


Where Is The Stock Market Headed?
Stock-Markets / Stock Markets 2011 Aug 09, 2011 - 05:20 AM GMTBy: Tony_Pallotta

 "He observed that human emotions collectively had major impacts on the movement of stock prices and Markets in general, ultimately creating patterns that kept repeating." - From a book on Jesse Livermore's trading style.
Markets at major inflection points are more a function of investor psychology and less technicals and or macro data. The struggle between bull and bear, greed and fear will always play a major role in the success and failure of investors. As Jesse Livermore discusses these struggles are a reflection of human emotions and since human emotion never changes they leave patterns that are repeated.
Up until now the 2007 topping pattern was a spot on comparison. It was ominous in terms of daily candlesticks through last Friday. In fact Friday was probably the most ominous of repeated candlesticks considering the massive swings during the day. Then today came and the market showed its hand. The market showed that great levels of fear and leverage still exist. Buyers are not stepping in and until the supply demand imbalance is resolved this market will move lower.
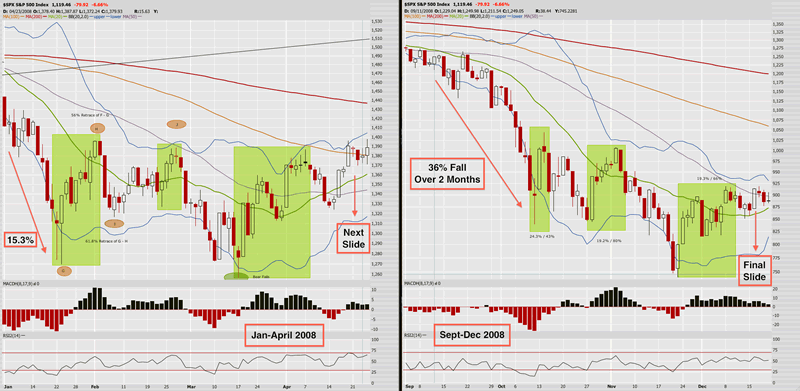
Over the weekend I began studying the fall of 2008 charts to see if any other patterns developed. What I found was a similarity between the late 2007 market and the fall of 2008 as shown below. The pattern is a series of rallies some rather substantial leading to subsequent selloffs before one final and move lower.
Perhaps the reason for this is that many traders miss the first move whether they fail to initiate a short or fail to get out of longs. I believe this is what sets up the next few rallies until the market finally moves lower and puts in a longer term tradable bottom. A few points regarding the chart below.
In early 2008 the initial selloff which I had been tracking was 15.3% and until today we were right at those levels.
In the fall of 2008 the selloff lasted two months and was 36%. In fact the ultimate trading bottom of March 2009 was almost reached in the fall of 2008 when the SPX touched 835.
I believe the fall of 2008 is more comparable in terms of this initial move lower. In the fall of 2008 there was Lehman, Fannie and Freddie and AIG all collapsing. Today we have Bank Of America, Citi and sovereign nations like Greece, Ireland, Italy, Portugal and Spain.
Notice the similarities between the three rallies and subsequent selloffs as highlighted below. That is the emotional pattern I believe will repeat after this initial selloff ends.
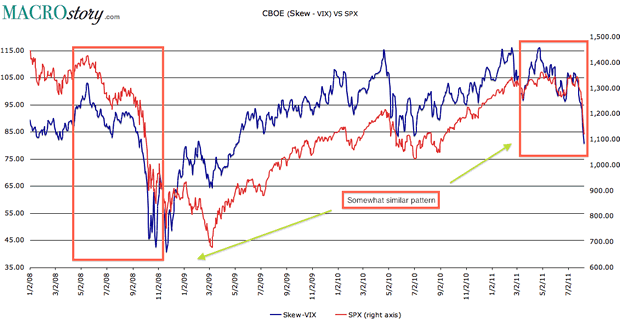
Long Term Divergence VS SPX
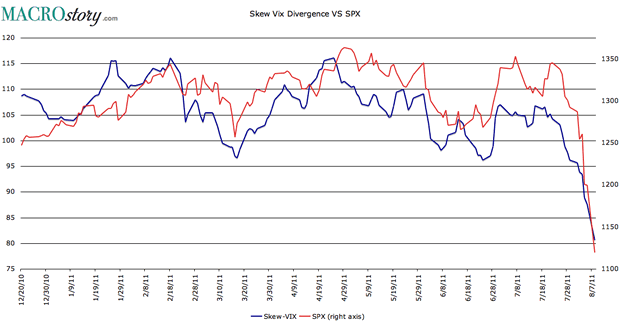
Both the long and short term IV skew charts show no signs of selling pressure letting up.
Short Term Divergence VS SPX
As I've stated before I wish I could be more definitive here. This market really showed its hand today. The late day selloff was a sign of funds and or individual investors waiting for a chance to sell into strength to meet margin and or redemption calls only to find lower prices and forced to sell at the close. Bank Of America remains a wild card as well and the companies statement today basically said the market had it wrong. Not the calming words long investors want to hear.
What the fall 2008 pattern shows us is this market can remain oversold for a very long time. Initiating short positions at these levels is very difficult unless one is using hedged option trades such as vertical spreads. The volatility could easily turn a winning trade into a losing one.
Lastly, remember it is human nature for others to relay their fears and limitations upon an event beyond their control. I'm listening to Carl Icahn right now say how this selloff is way overdone. He doesn't see it lastly any longer but what basis does he have for saying that? Other than talking his book he has none. Don't be greedy and don't be a hero. There may very well be more selling ahead of this market.
By Tony PallottaBio: A Boston native, I now live in Denver, Colorado with my wife and two little girls. I trade for a living and primarily focus on options. I love selling theta and vega and taking the other side of a trade. I have a solid technical analysis background but much prefer the macro trade. Being able to combine both skills and an understanding of my "emotional capital" has helped me in my career.
© 2011 Copyright Tony Pallotta - Disclaimer: The above is a matter of opinion provided for general information purposes only and is not intended as investment advice. Information and analysis above are derived from sources and utilising methods believed to be reliable, but we cannot accept responsibility for any losses you may incur as a result of this analysis. Individuals should consult with their personal financial advisors.
© 2005-2022 http://www.MarketOracle.co.uk - The Market Oracle is a FREE Daily Financial Markets Analysis & Forecasting online publication.