


Stock Market Downtrend Could Make a Double Bottom
Stock-Markets / Stock Markets 2011 Aug 07, 2011 - 05:55 AM GMTBy: Tony_Caldaro

 In the US, the market recovered from its midday low on friday to close mixed but still posted the worse weekly decline since the early May 2010 flash crash. Europe, however, was not that fortunate and ended the week with their worse weekly decline since November 2008. The SPX/DOW lost 6.5%, and the NDX/NAZ were – 7.6%. Asian markets performed best losing 5.4%. While Europe lost 10.6%, the Commodity equity group lost 8.5%, and the DJ World index dropped 8.8%. We now have six of the fifteen international indices we track in confirmed bear markets, with the rest likely to follow.
On the economic front reports ended the week mixed. On the positive side: construction spending, personal income, auto sales, the payrolls report, consumer credit and the WLEI all improved. On the negative side: ISM manufacturing/services, personal spending, the ADP index, and factory orders all declined. The unemployment rate nudged lower, while weekly jobless claims nudged higher. Next week all eyes will be on tuesday’s FED FOMC meeting. The twin deficits and retail sales will also be reported.
LONG TERM: bear market highly probable
For quite a while now we have been reporting on the technical deterioration in the foreign markets, and the negative divergences in 75% of our long term indicators. These repeated warnings came to fruition this week as markets worldwide tumbled. We hope most heeded the call, beginning about three weeks ago, to take a defensive investment posture until the inflection point resolved itself. Fortunately, it resolved itself on monday with the market about 5.5% off its closing high. Unfortunately, it projected a new bear market and by friday the market ended 12.1% off the closing bull market high. So what’s next?
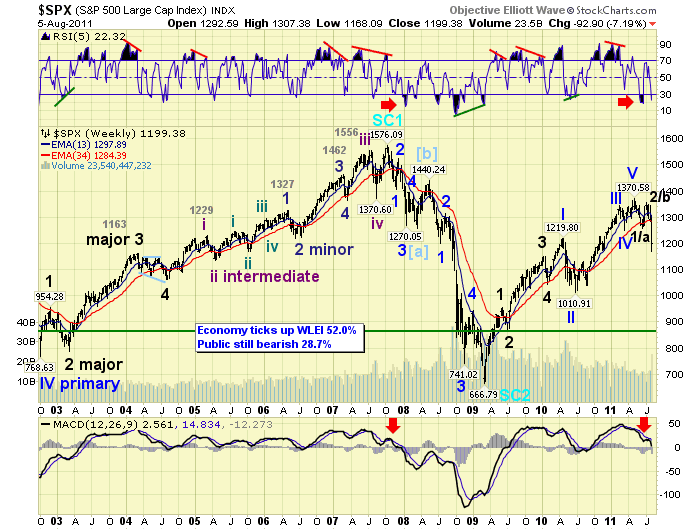
We’re expecting a long term downtrend to be confirmed by OEW analysis in the near future. Until then we have a wave structure, and now a drastic decline, that supports the new bear market scenario. The bull market of March 2009 advanced in five Primary waves to complete Cycle wave [1]. Primary wave I divided into five Major waves, and Primary waves III and V did not. They were simple structures. A Cycle wave [2] bear market should now be underway.
Initially we estimate this bear market could take between one and three years. If one year it should bottom in either Q3 or Q4 of 2012, along with the 2-year Tech cycle. If three years it should bottom in Q3 or Q4 of 2014, along with the next Tech cycle low and the 4-year Presidential cycle. In regard to price. Typically corrections to bull markets find support at the previous 4th wave of a lesser degree if the fifth wave was strong. This one was quite weak, so support notches down to the low of Primary II at SPX 1011. However, since this should be a Cycle wave bear market it could drop as low as the low of Major wave 2 of Primary I at SPX 869. We have a green line posted at that level on the above weekly chart. A decline of this nature would represent about a 70.7% retracement of the bull market, and a total loss of about 37% for the stock market. Project, monitor and adjust when necessary.
MEDIUM TERM: downtrend low SPX 1168
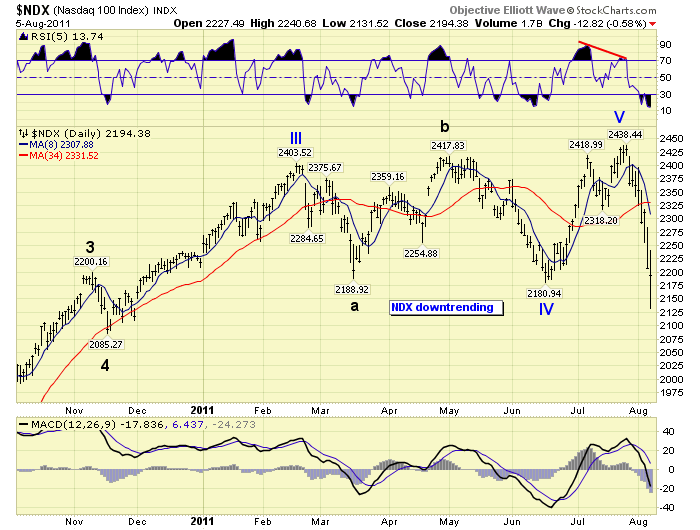
The bear market in the SPX/DOW started in early May. Kudos to several in our group who called it, we posted their counts. The bear market in the NDX/NAZ started in late July. During that month is when we publicly started to turn bearish. Since we mainly cover the SPX/DOW our report will continue based on that wave structure.
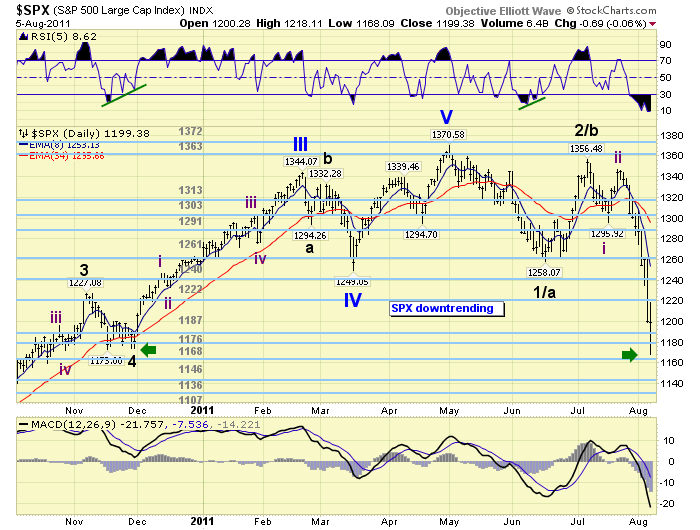
The first decline in the SPX from May-June was 113 points (1371-1258), we labeled it Major wave 1/a. Since this is the beginning of a bear market we can not determine, in advance, if the larger three wave structure will take the form of a 5-3-5, or an abA-B-abC complex three. Remember bull markets unfold in five waves, and bear markets in three waves. The counter-trend rally from June-July was 98 points (1258-1356), we labeled it Major wave 2/b. This uptrend retraced an unusually high 87% of the previous downtrend. The reason for this is the NDX/NAZ had to complete their bull markets by making new highs. When the current downtrend began, early July for the SPX and late July for the NDX, it started in a gradual manner like the first downtrend of the bear market. When it broke through the March (SPX 1249) and June (SPX 1258) lows on wednesday it accelerated to the downside on thursday/friday. At friday’s low this downtrend had already declined 188 points (SPX 1356-1168). Marking the total correction, thus far, from the SPX 1371 bull market high at 14.6%.
At friday’s low, SPX 1168, the market found support at the Major wave 4 low of Primary wave III (SPX 1173). This is very important support, in that, it represents a bit more than a 1.618 relationship to wave 1/a, hit the OEW 1168 pivot exactly, and the hourly chart displays the most oversold condition since November 2008. Should this level fail to hold, Fibonacci analysis suggests the next important levels of support for are at SPX 1130 (wave 3/c = 2.0 wave a) and SPX 1060 (wave 3/c = 2.618 wave a).
SHORT TERM
Current support for the SPX is at 1187 and then 1168, with resistance at 1222 and then 1240. Short term momentum displayed a positive divergence at friday’s low and the market responded with its best rally (46 points) since this current decline began from SPX 1347. We have been labeling this downtrend as a five wave sequence: Intermediate wave i SPX 1296, Int. wave ii SPX 1347 and Int. wave iii underway. We tentatively placed an Int. iii green label at the SPX 1168 low. The market would, currently, have to go sideways for several days or get above the OEW 1240 pivot to help confirm that count.
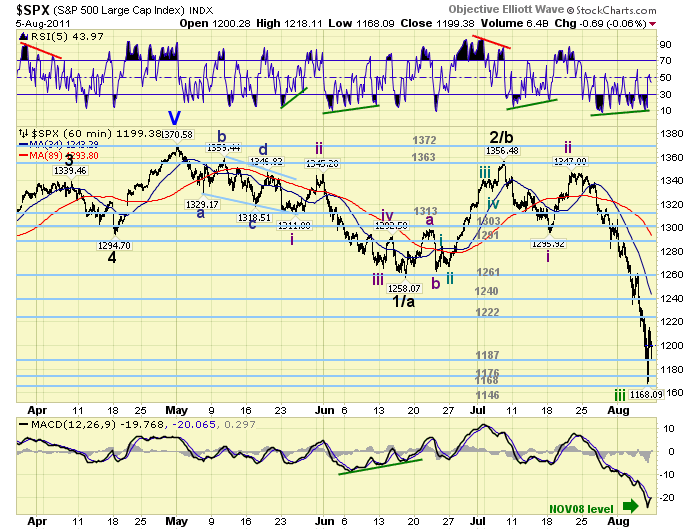
Should this occur the downtrend could make a double bottom around the OEW 1168 pivot and conclude. If not, we could hit the October 2008 extreme oversold condition of the last bear market. With the S&P downgrade of US debt to AA+ on friday night, the FED’s response: http://www.federalreserve.gov/newsevents/press/bcreg/20110805a.htm, and the FOMC meeting on tuesday. This event could possibly be used as an excuse for QE 3. Europe’s ECB just started another QE program by pledging to support the bond markets in Spain and Italy. The next few days should prove to be quite interesting.
FOREIGN MARKETS
The Asian markets were all lower on the week, are all downtrending, and lost 5.4%. Australia, China and Japan are in confirmed bear markets.
The European markets all dropped quite hard this week, all are downtrending, and lost 10.6%. Spain, Switzerland and the Stox are in confirmed bear markets.
The Commodity equity group were also hit quite hard, all downtrending, and lost 8.5% on the week. Brazil remains in a confirmed bear market.
COMMODITIES
Bonds are uptrending and benefitted from the stock market turmoil +1.6% on the week. 10-Year yields dropped to a yearly low of 2.43%. The 1-Year hit a record low of 0.11% yield.
Crude was hammered this week losing 9.7% and remains in a downtrend. May need QE 3 to resume its bull market.
Gold is uptrending and also benefitted from the turmoil, gaining 2.2% on the week. Silver, however, lost 3.9% on the week suggesting we may have seen the current uptrend highs for these metals. Either way this bull market continues.
The downtrending USD also benefitted from the turmoil and the BOJ currency intervention, gaining 1.0% on the week. The EUR/USD lost 0.8% and the JPY/USD lost 2.0%.
NEXT WEEK
Tuesday kicks off the economic week with the Q2 Productivity report and the FED’s FOMC statement that afternoon. There may be another press conference. Wednesday we have Wholesale inventories and the Budget deficit. Then on thursday the weekly Jobless claims and Trade deficit. On friday, Retail sales, Consumer sentiment and Business inventories. Nothing yet on the FED’s agenda except the meeting. Be careful with your investment dollars, markets drop a lot faster than they go up. Best to your weekend and week!
CHARTS: http://stockcharts.com/...
http://caldaroew.spaces.live.com
After about 40 years of investing in the markets one learns that the markets are constantly changing, not only in price, but in what drives the markets. In the 1960s, the Nifty Fifty were the leaders of the stock market. In the 1970s, stock selection using Technical Analysis was important, as the market stayed with a trading range for the entire decade. In the 1980s, the market finally broke out of it doldrums, as the DOW broke through 1100 in 1982, and launched the greatest bull market on record.
Sharing is an important aspect of a life. Over 100 people have joined our group, from all walks of life, covering twenty three countries across the globe. It's been the most fun I have ever had in the market. Sharing uncommon knowledge, with investors. In hope of aiding them in finding their financial independence.
Copyright © 2011 Tony Caldaro - All Rights Reserved Disclaimer: The above is a matter of opinion provided for general information purposes only and is not intended as investment advice. Information and analysis above are derived from sources and utilising methods believed to be reliable, but we cannot accept responsibility for any losses you may incur as a result of this analysis. Individuals should consult with their personal financial advisors.
© 2005-2022 http://www.MarketOracle.co.uk - The Market Oracle is a FREE Daily Financial Markets Analysis & Forecasting online publication.