


Stock Market Just Keeps Getting Crazier
Stock-Markets / Stock Markets 2011 Aug 07, 2011 - 05:43 AM GMT

 What can you say about this week, mental and crazy swings, although I am sure there will be some hurting traders after all is said and done.
Last week I left readers with these comments.
"there is a setup for the bulls as long as 1258SPX holds, although I would prefer not to get that close to those lows, then the bulls have to "show us da money" and buy aggressively or they face losing the support areas we are currently vibrating.
Failure to hold these levels is a big issue for the bulls, as the market can be setting up for a substantial downside move."
Failure was indeed seen from the bulls; although I was bullish going into 1280SPX as of last week the setup was still a bullish setup, we were flirting with the uptrend line from the March 2009 lows, and vibrating the 200DMA, the bulls need to deliver above some key areas on resistance, we had the 1316ES area penciled in as a bull/bear line, of course the rest is history as the market preceded to again test the 1280SPX area having failed to get above 1316ES.
I posted this analogue to members well before the heart of the moves seen this week.
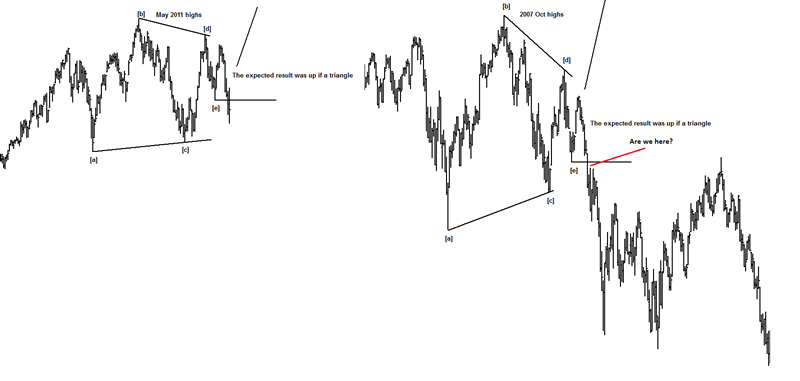
It appears that we could be following that same script; we knew that failure to hold the 1280SPX area of support can potentially a waterfall type move, well that's an understatement.
Being wrong on any idea is fine, as traders/investors will always get moves wrong, being bullish at the lows is the un-natural thing to do, but it's what has stood me the test of time, I like to buy when others are looking crashes and sell when others are looking to the moon.
Occasionally there are times when you witness rare events like we saw this past week, but setting out your stall for such a move is like waiting for a the lottery ticket numbers.
Now I am sure that many of you will read many articles from other publications how they caught the "top" and how they predicted the crash we saw last week, and I will openly admit I did not think we would see such a move, but it actually made no difference to me and members as we reversed our bias and got bearish.
You see I am not in the business of calling crashes and the market to go to the moon etc, I leave that bit of the industry to the pen pushers, at wavepatterntraders.com we deal with the facts, and we don't claim to have any answers to foresee 6 months ahead.
Now I am equally sure that there will be publications calling for crashes and how they "nailed" the top and the wave 3 to Dow 1000 is coming, but what you also need to be aware, is that many have selective memories as most bearish analysts have been calling crashes for at least the past 12 months. Or trying to sell at every opportunity they got looking for the elusive wave 3.
How did that work out for those traders? We on the other hand were truthful to what price was suggesting, and the result was a near 400 point rally in the S&P as the bears continued to fight that move.
Now that the tape is potentially bearish I wonder if any of those bears have any $$$ to actually trade this decline? I fear not many left, as I suspect many were broke before the move you saw this week.
Being wrong on any such crash by 12 months is wrong in my book, selling against a 400 point move is a complete joke.
Looking back at last week's price action, I don't think we would have traded it any different to the way we have traded the rally over the past 12 months.
We traded what we thought was the probable pattern, but make no mistake; we reversed our bias in the week, once we knew our bullish idea was busted.
I have far more respect for technical analysts that admit when they get things wrong, than twist things to adjust to their bias, and get a little creative and stick with the same bias even though it's clearly wrong as it has been for the past 2 years from the bears.
The bears have been fighting the rally for the past 2 years from Mar 2009, and it appears finally they may have their shot and tanking the market.
Just as the bears appear to have the edge, the bulls do not want to get complacent and think this is a correction, imo this is something far more serious, although I could be proved wrong and only price will prove that.
I have seen a lot of technical damage done to this market this week, and imo the bulls were in denial to stand through that level of pain, cutting and running on any bullish idea was a sound trade that we took.
We are no perma bears or perma bulls, at the time we traded what we thought was the most probable outcome, seeing support lost should have gave warning to any bullish trader and get out of the markets or even get short, which is what we did, we got short last week and traded some of those insane moves, and traded short once the 1280SPX area was broken.
Being wrong on any idea is fine in my book, traders should always expect to get things wrong, loosing is part of wining in this trade, and if price action suggests reversing your bias, that is what you must do, it's what we do all the time, and last week was a great week to prove that, as the forum and site was opened up to guests as per last week's article so the world could see that once our key areas of support was lost, we needed to respect that and reverse bias.
Any bullish trader that never got out last week under the break of the 1280SPX and 200DMA was imo living in denial; he/she clearly does not understand risk.
I suspect just as the bears were in denial from the March 2009 lows until this year, the bulls will be in denial if this market really gets going to the downside.
Cutting a losing trade and reversing is something that I push hard onto to members and it's ok to have a wrong idea, but being stubborn about an idea, well.......... that's just plain stupid.
SPX
No question about it, that's some serious damage on the market, and I think traders should respect the damage, although as of Fridays low, a potential short term low could be in place, but I suspect we have a few more gyrations left before a meaningful low is seen, and one that can see a sustainable rally to correct a good portion of this decline, and certainly one that can be tradable, although with the crazy swings, I have been advising members to open up stops and adjust risk accordingly.
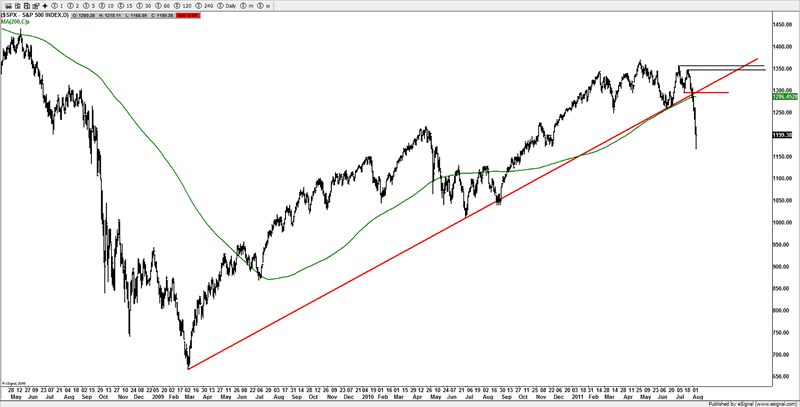
That's clearly a violation of the uptrend and whilst there is never a sure thing in the markets, the likely hood atm, is that we have started something far more serious. A clear break of the 1280SPX support, the 200DMA and the uptrend line, should have had bulls running to the exits, which is exactly what appeals to have happened as you saw the waterfall this week.
If the analogue is working out or something similar then we likely have a bit lower to go before we put in a meaningful low and one that could see a substantial move higher.
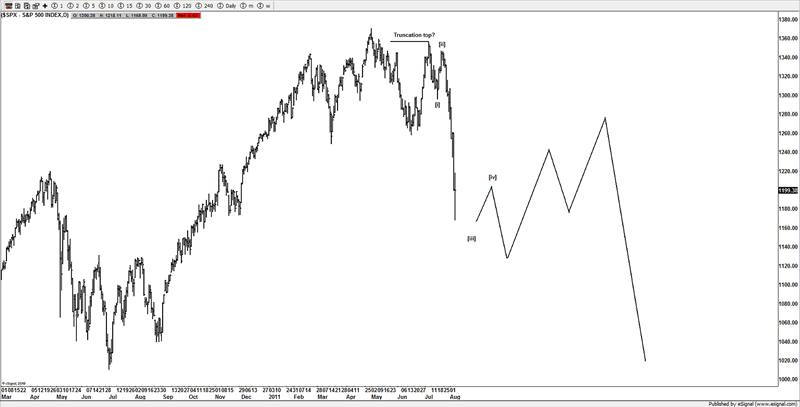
If the market has indeed started something more bearish then I suspect we move something like this, and an initial 5 wave decline followed by a 3 wave advance, that's a simplistic view of Elliott Wave Analysis, internal waves and up-date wave counts are for members with key support and resistance area to help navigate risk and the gyrations as they happen in real time.
I suspect at some stage we could come back to test the 1280SPX area and the 200DMA much like we did back in May 2008 before we rolled over and crashed.
XLF VS SPX
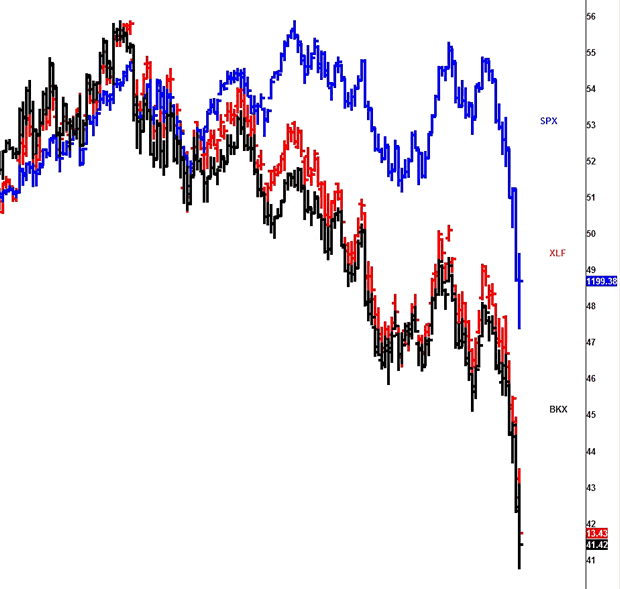
Until the financials bottom out, I don't think you will see a substantial rally just yet, the market probably needs to see a bounce and a retest of the lows and probably lower to shake out early buyers, it's likely at that time many will be thinking that the market will be going far far lower, when it will be ripe for a decent retracement of the declines we have already seen.
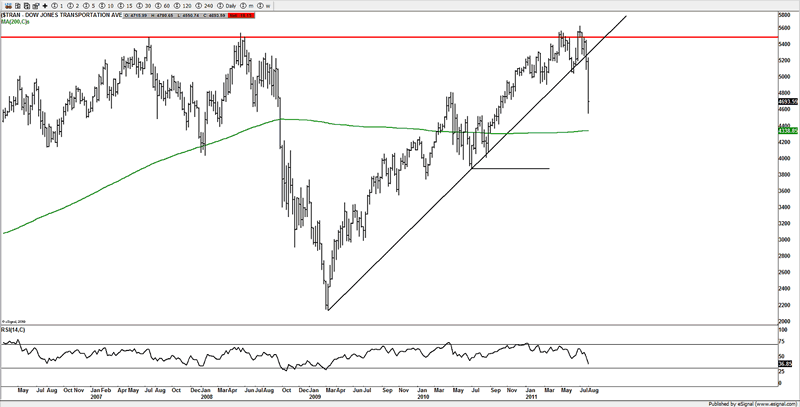
Transports
Looks like a failure top, the rejection is very telling.
Free Week update
Last week I opened the door up for guests to view my work, and I have had a very positive response judging from the E-mails I received, I hope that many of the readers took advantage of the setups that were posted in the forums and had a taste of what we do and how we try to stay on top of the many markets.
It's not easy keeping on top of these swings and having to consistently come up with ideas, but that's what we do day in day out.
We are not "crash" experts", or " to the moon" experts, in this sort of environment its throwing up so many chances that traders that are clearly interested in trading these swings are going to get chances to make a lot of $$$$$$$.
Now is the time to take advantage of that and join up, for the equivalent of just 1 ES point per month, I believe it's the best value for money analysis on the web, I have yet to come across any site that has half as much as we post for the price.
Don't take my word for it, try it out and take advantage of the 4 week trial, with daily 20 handle swings, you only need one of those to pay for a year's membership. The ES is just one of 15-20 markets that I follow.
The swings are huge and stops need to be taken into account, as depending on the skill of the trader, will denote his/her risk tolerance, as each trade is based on his/her account and trade positions and traders need to adjust for the type of environment.
It's no good being right on a idea if you keep getting stopped out because you don't have the right size on per your account, sadly I see too much drivel written these days about the markets, yet not enough about size positions to allow for the crazy swings you see.
It's been a full time job this week to keep on top of these swings, and I can only cringe at what some traders are thinking when they have to wait for daily or 3 x weekly publications.
These sort of markets need a hands on approach as you can make a lot of money if you are switched on and in the zone, trading 30 handle moves in one day is likely to be common place, and those opportunities can be seen in a day not a week or month, and that's just the US markets.
The market has seen some crazy moves in the FX markets, we are regularly seeing 200 pip daily moves in some pairs, and creating some great trading conditions, those that are actively looking for setups are taking full advantage of the moves.
Conclusion
I suspect we will see lower over the coming weeks, before putting in a substantial low and one that should see a good portion of the decline reached, that decline should be a 3 wave bounce, much like the rally that was seen in the March-May 2008 period, before another leg lower.
As a consequence of what I have seen, I have switched my bias from bullish to neutral/bearish, I suspect we have further to go before this current decline is finished before the selling exhausts and the bulls can jump back in and buy up cheap shares and see a decent rally.
I do have some clear areas above that the bears need to respect, as long as those areas are respected the trend will likely push lower, as its going to need something very special to see the moves we saw the past few weeks retraced. Never say never, but as long as price confirms my near term ideas then we need to respect the potential for far far lower, given what we have seen so far this week.
Until next time.
Have a profitable week ahead.
Click here to become a member
You can also follow us on twitter
What do we offer?
Short and long term analysis on US and European markets, various major FX pairs, commodities from Gold and silver to markets like natural gas.
Daily analysis on where I think the market is going with key support and resistance areas, we move and adjust as the market adjusts.
A chat room where members can discuss ideas with me or other members.
Members get to know who is moving the markets in the S&P pits*
*I have permission to post comments from the audio I hear from the S&P pits.
If you looking for quality analysis from someone that actually looks at multiple charts and works hard at providing members information to stay on the right side of the trends and making $$$, why not give the site a trial.
If any of the readers want to see this article in a PDF format.
Please send an e-mail to Enquires@wavepatterntraders.com
Please put in the header PDF, or make it known that you want to be added to the mailing list for any future articles.
Or if you have any questions about becoming a member, please use the email address above.
If you like what you see, or want to see more of my work, then please sign up for the 4 week trial.
This article is just a small portion of the markets I follow.
I cover many markets, from FX to US equities, right the way through to commodities.
If I have the data I am more than willing to offer requests to members.
Currently new members can sign up for a 4 week free trial to test drive the site, and see if my work can help in your trading and if it meets your requirements.
If you don't like what you see, then drop me an email within the 1st 4 weeks from when you join, and ask for a no questions refund.
You simply have nothing to lose.
By Jason Soni AKA Nouf
© 2011 Copyright Jason Soni AKA Nouf - All Rights Reserved
Disclaimer: The above is a matter of opinion provided for general information purposes only and is not intended as investment advice. Information and analysis above are derived from sources and utilising methods believed to be reliable, but we cannot accept responsibility for any losses you may incur as a result of this analysis. Individuals should consult with their personal financial advisors.
© 2005-2022 http://www.MarketOracle.co.uk - The Market Oracle is a FREE Daily Financial Markets Analysis & Forecasting online publication.