U.S. Yield Curve Flattening To Prompt Fed Monetary Easing and Gold $1800
Commodities / Gold and Silver 2011 Aug 03, 2011 - 06:27 AM GMTBy: Bob_Kirtley
 Gold prices made yet more all time highs in the last trading session, propelled by what we think was a short squeeze. Many traders were probably betting that gold prices would decline once the US debt ceiling was resolved; however this was not the case. In this article we will outline one longer term factor that we think will drive gold prices past $1800 in the next six months; the flattening of the US Yield curve. We believe the flattening of this curve is a symptom of economic weakness and coupled with rising unemployment will be the catalyst for the Fed to embark on another round of monetary easing which will send gold prices past $1800. In fact, $1800 is a conservative target.
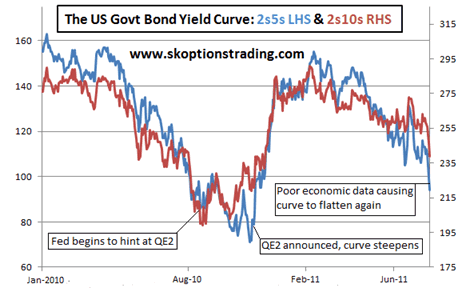
Weaker economic data from the US has caused the yield curve for US Treasuries to flatten significantly in recent months. However when the July manufacturing ISM came in at 50.9, well below the predictions of around 55.5, the curve flattened to a level not seen since August 2010. It was in August 2010 that the Fed first hinted at QE2 and therefore the fact that the curve has got back to this level puts pressure on the Fed to embark on another round of monetary easing. Whether this will be through QE3 or some other mechanism we do not know, however we are confident that further easing of US monetary policy is very bullish for gold prices.
For those readers who may be unfamiliar with how the yield curve works, we will provide a brief explanation. Bonds of different maturities have different yields. By plotting these yields against their maturities we can build a yield curve. The yield curve becomes steeper if longer term interest rates increase relative to shorter term interest rates. The yield curve becomes flatter if longer term interest rates decrease relative to shorter term interest rates. One way to measure the steepness of the yield curve is to look at the difference between the yields at two different points on the curve. For example one may look at the difference between the yields on 2 year Treasuries compared to the yield on 5 year Treasuries. Such a comparison will often be referred to as “2s5s” and is measured in basis points (bps) by subtracting the shorter term yield from the longer term yield. So if one says “2s5s are trading at +225” this means that the yield on 5 year bonds is 2.25% higher than the yield on 2 year bonds. If 2s5s go from +225 to +275 then the yield curve has steepened between those two maturities. If 2s5s go from +225 to +175 then the yield curve has flattened between those two maturities.
Now there is no one exact interpretation of what causes shifts in the yield curve. The curve changes with changes in inflationary expectations, default risk, equity markets, the outlook for future interest rates as well as other factors.
However in our opinion the recent run of poor US economic data has been causing the curve to flatten. A weaker economy means that interest rates will probably be held lower for longer, therefore longer term interest rates fall relative to shorter term interest rates, causing a flattening of the curve.
We view gold as a currency and since currencies are tightly linked with interest rates, we have a large focus on the US and global interest rate market. We are bringing your attention to the flattening of the curve since it has now reached a level not seen since August 2010, when the Fed first hinted that QE2 was going to be carried out. The chart below illustrates our point.

This flattening of the curve is a symptom of a weakening economy and if this continues it puts pressure on the Fed to act; particularly if unemployment begins to rise again. Further monetary easing by the Fed is massively bullish for gold prices.
This Friday we have the US non-farm payroll data and if this figure comes in below expectations, as it has done for the past couple of months, this will increase the pressure on the Fed to act. This coupled with a drop in core inflation would almost guarantee further monetary easing. Remember that unlike some central banks the Fed has a dual mandate to maintain price stability and full employment; therefore it is not enough that core inflation is within a tolerable range; the unemployment rate must come down too.
In terms of what form further easing from the Fed could take, there are a number of options. We could see another round of QE or other asset purchase programs. However since QE1 and QE2 have not provided a sustainable recovery, there is a strong possibility that the Fed will try something different this time. First we would expect to see a change in the language of the Fed statement, a change that implies that interest rates will remain lower for longer. We then could see the Fed setting a cap on longer term interest rates, such as the 2 year or 5 year rate on Treasuries. All these forms of monetary easing are massively bullish for gold prices.
However despite this August bearing significant similarities to August 2010, it is important to highlight the differences. The most important of these is that inflation is much higher. In the US core CPI increased at an annualized rate of 2.5% over the last six months. However inflation expectations are at levels consistent with the Fed’s mandate. Therefore we do not think that the threat of inflation will prevent the Fed from easing, since it is still in its target range and even if inflation moves out of its target range the Fed believes it can contain inflation easily by raising interest rates. The other half of its mandate, unemployment, is well outside its range and in the Fed’s view presents the larger threat at this point in time.
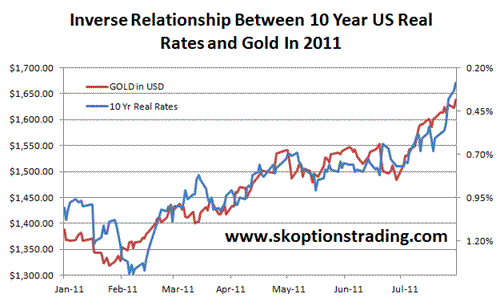
In summary this is how we view the dynamics of the US interest rate market affecting gold; The yield curve has flattened and may continue to do to, this shows economic weakness in the US. With a weak economy unemployment is unlikely to fall and will most probably rise. This will prompt the Fed to embark on additional monetary easing in an attempt to boost economic growth and combat unemployment. Monetary easing is bullish for gold, as shown by its inverse relationship with US real interest rates in the chart below. (Please also see our previous article: Decline In US Real Rates To Send Gold Past $1800 for further explanation of this relationship. We view it as the key determinant of gold prices in the medium to long term)

For those subscribers who are too busy to trade their own accounts we are now able to offer an Autotrading program with our SK OptionTrader service, as we are pleased to announce that we have entered into a partnership with Global AutoTrading and therefore autotrading is now available for SK OptionTrader signals
To stay updated on our market commentary, which gold stocks we are buying and why, please subscribe to The Gold Prices Newsletter, completely FREE of charge. Simply click here and enter your email address. (Winners of the GoldDrivers Stock Picking Competition 2007)
For those readers who are also interested in the silver bull market that is currently unfolding, you may want to subscribe to our Free Silver Prices Newsletter.
DISCLAIMER : Gold Prices makes no guarantee or warranty on the accuracy or completeness of the data provided on this site. Nothing contained herein is intended or shall be deemed to be investment advice, implied or otherwise. This website represents our views and nothing more than that. Always consult your registered advisor to assist you with your investments. We accept no liability for any loss arising from the use of the data contained on this website. We may or may not hold a position in these securities at any given time and reserve the right to buy and sell as we think fit. Bob Kirtley Archive |
© 2005-2022 http://www.MarketOracle.co.uk - The Market Oracle is a FREE Daily Financial Markets Analysis & Forecasting online publication.


