


Stock Market Panic Selling Provides Major Buying Opportunity!
Stock-Markets / Stock Markets 2011 Aug 01, 2011 - 04:48 AM GMTBy: Chris_Vermeulen

 Over the past seven trading sessions we have seen stocks plummet in price because of the debt issues in the United States. I think a lot of individuals including myself thought that a bill would have been passed last week and with a plan underway money would flow back into stocks for a relief bounce at minimum. Instead, nothing was passed and that lead to strong selling into Friday’s close.
The next couple weeks are going to be very interesting for stocks, bonds, currencies and commodities as traders and investors process this event as it unfolds.
Let’s step back and take a quick technical look at the chart…
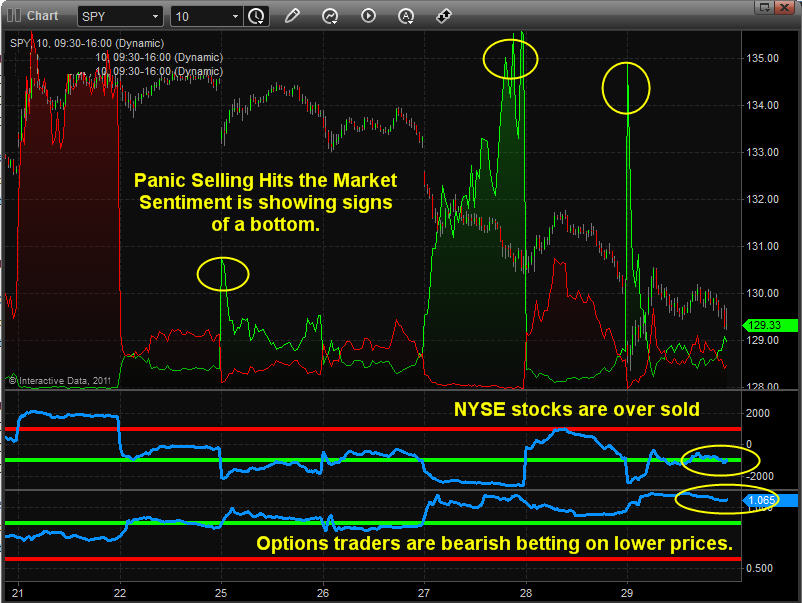
SPY – SP500 Index ETF – 10 Minute Chart
I call this chart my sentiment chart because I use three indicators to get a feel for what the masses are doing. The first indicator which is the green spikes on the price chart is my own custom indicator to measure panic selling in the stock market. Usually I look for strong selling days followed by an exhaustion gap lower within 1-3 days.
As you can see below, the last panic selling spike took place on a large gap down only 2 days after we saw extreme panic selling which actually got stronger as the session grew older. This is a bullish sign in my opinion.
Also if you look at the two other indicators at the bottom we can see the NYSE advance decline line trading down in an oversold zone. And the very bottom indicator is the put/call ratio showing everyone is trading puts and that means they are betting on lower prices.
To sum this chart up quickly I can tell that traders are selling everything they own because they are scared, stocks have moved down to quickly and likely ready for a bounce and also that options traders are expecting lower prices. So if everyone is bearish and has already sold their positions it only makes sense that a bounce or rally should take place in the next few sessions.
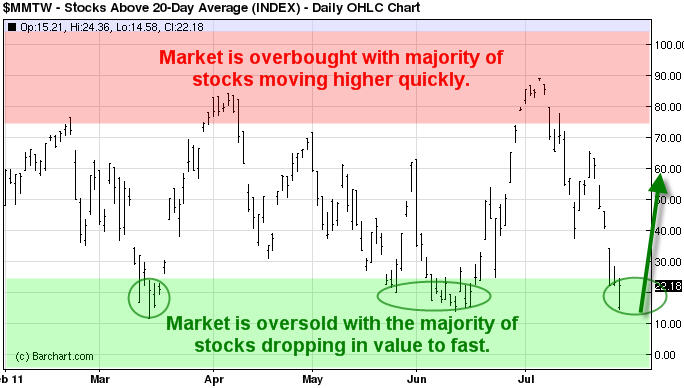
Percentage of Stocks Trading Above the 20 Moving Average
This chart helps me get more of an intermediate trend analysis for if stocks are oversold or over bought. This chart tells us the percentage of stocks that are trading above their 20 day moving average.
This is how I use the info:
Example: If we are in a long term bull market which we currently are... then I look at buy during these oversold conditions. Once this chart reaches the 75%+ level I become more aggressive with my positions and actively manage them (Take partial profits, tighten stops).
Example 2: During a major bear market you to the opposite (build short positions on the bounces to 75%+ level and then cover partial positions and tighten stops once stocks are oversold and ready for a dead cat bounce once below the 25% level.
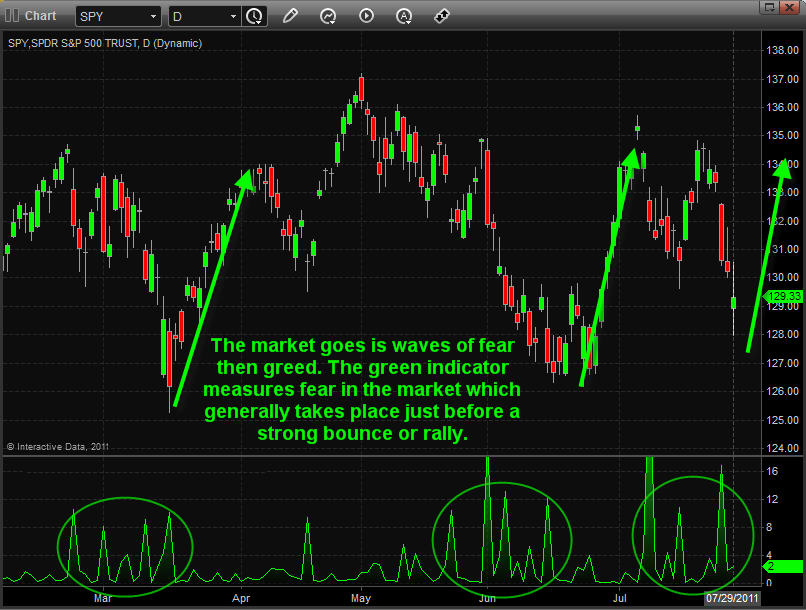
SPY Daily Chart
This chart below allows us to get a longer term view of my panic selling indicator. As we all know the market moves in waves (fear and greed). So with the SP500 traded by individual’s from all around the world it generally takes 5-15 days for everyone to become fearful and or greedy and to take action with their investments. This can be seen from looking at how long it takes for the sellers unload their positions.
If things play out in favor of what the charts are telling me we should have a nice bounce or rally just around the corner. Again this analysis is based strictly on technical analysis and not on economic data. Adding the economic/political data makes things very confusing and interesting to say the least and they do not always to hand-in-hand.
Weekend Trading Conclusion:
In short, this coming week the market has a big wild card on the table. Until we know what that is be very cautious with trading positions. Just now/tonight Obama said a deal was reached to end debt issue and urges both parties to do the right thing and support this deal over the next 2 days. This deal will raise the debt limit and will cut $2.5 trillion from the deficit over the next 10 years.
We are seeing a 20 point jump in the SP500 futures from this news just moments ago so this just may be the bounce/rally I am looking for.
Technically I feel higher prices should take place in stocks but we may have a couple volatile sessions with lower prices before a strong jump in price as this news is not set in stone just yet and we have a couple days before we know what the final decision is…
If you would like to get more of my daily analysis to join my newsletter at www.GoldAndOilGuy.com
By Chris Vermeulen
Chris@TheGoldAndOilGuy.com
Please visit my website for more information. http://www.TheGoldAndOilGuy.com
Chris Vermeulen is Founder of the popular trading site TheGoldAndOilGuy.com. There he shares his highly successful, low-risk trading method. For 6 years Chris has been a leader in teaching others to skillfully trade in gold, oil, and silver in both bull and bear markets. Subscribers to his service depend on Chris' uniquely consistent investment opportunities that carry exceptionally low risk and high return.
This article is intended solely for information purposes. The opinions are those of the author only. Please conduct further research and consult your financial advisor before making any investment/trading decision. No responsibility can be accepted for losses that may result as a consequence of trading on the basis of this analysis.
© 2005-2022 http://www.MarketOracle.co.uk - The Market Oracle is a FREE Daily Financial Markets Analysis & Forecasting online publication.