


Interbank Credit Markets Show Low Systemic Risk
Stock-Markets / US Interest Rates Jul 31, 2011 - 08:38 AM GMTBy: Steven_Vincent

 Tape action--market responsiveness to news, earnings and technical events--has been largely bullish as well. Psychology appears to be sufficiently negative to support a bottom as well. While doom and gloom are not at apocalyptic levels, there is a pervasive sense that after six months of grind and whipsaw, traders are tired and at a loss and are sitting on the sidelines waiting for the right cue. All in all, this is the stuff of which major bottoms are made. BullBear Traders are looking to build long positions as the market passes through a bottoming process soon, probably coinciding with the announcements of the downgrade of US sovereign debt and a DC debt deal. We are also keeping our eyes open to the possibility of a significant bearish market break.
Recently there was broad expectation that a failure of the US Congress to reach an agreement on raising the national debt ceiling and a default by Greece would initiate a Lehman-esque debacle in world equity markets. Essentially, both occurred within a 24 hour period and the markets shrugged it off. The news is out and so far no signs of "collapse". This makes sense, since for quite a long time it's been obvious to any informed observer that the US and Greece are both bankrupt and that some form of default and downgrade would be forthcoming. Markets have had more than ample time to price in both events. And it seems that markets are distinguishing between corporate equity, which trades on the stock exchanges, and government debt. There is no sense at this time that the earnings and solvency of corporations need to be questioned in tandem with the fiscal condition of governments. Corporate balance sheets have never been healthier and P/E ratios are low.
Bears are warning that since the solvency of banks and the credit worthiness of assets worldwide is heavily dependent on the condition of the sovereign debt market, that simultaneous downgrades and defaults in the US and Europe would usher in another deep credit crunch and once again send world asset prices spiraling downward. It's interesting that the obscure workings of the interbank credit market became nearly mainstream news during the 2007-2009 credit crisis, but at this time garners no attention whatsoever. The rates at which financial entities measure risk were keenly watched during the financial crisis. At this time we are seeing absolutely no indication of any fear or abnormal risk in interbank lending.
The London Interbank Offered Rate (LIBOR) is a daily reference rate based on the interest rates at which banks borrow unsecured funds from other banks in the London wholesale money market (or interbank lending market). This can be seen from the point of view of the banks making the 'offers', as the interest rate at which the banks will lend to each other: that is 'offer' money in the form of a loan for various time periods (maturities) and in different currencies. At this time LIBOR is at a very low level which suggests that there is a very low perception of risk in interbank lending.
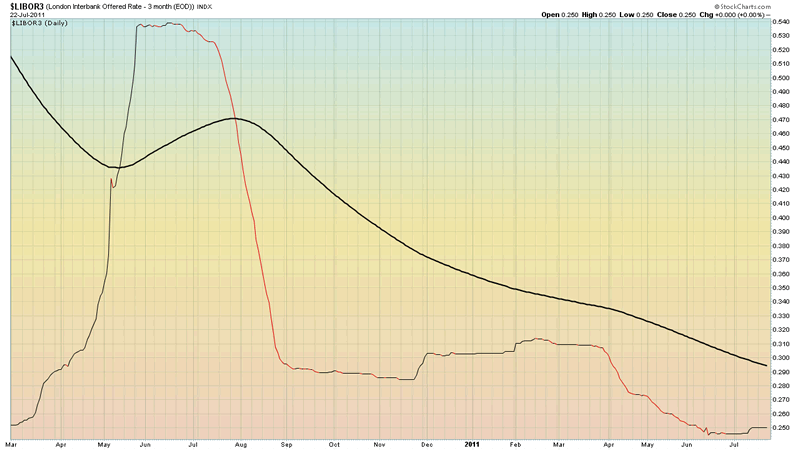
On Friday there was a small spike upwards as the likelihood of a downgrade of US debt increased and rating agencies put Spain's debt on watch for downgrade. We'll need to keep an eye on this, but so far the rate is far from crisis levels.
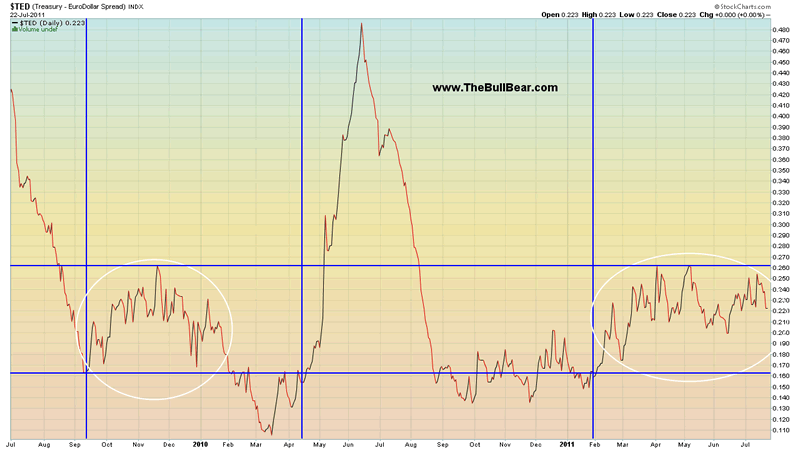
The TED spread is the difference between the interest rates on interbank loans and short-term U.S. government debt ("T-bills"). TED is an acronym formed from T-Bill and ED, the ticker symbol for the Eurodollar futures contract.
The TED spread fluctuates over time but generally has remained within the range of 10 and 50 bps (0.1% and 0.5%) except in times of financial crisis. A rising TED spread often presages a downturn in the U.S. stock market, as it indicates that liquidity is being withdrawn. The TED spread is an indicator of perceived credit risk in the general economy.[1] This is because T-bills are considered risk-free while LIBOR reflects the credit risk of lending to commercial banks. When the TED spread increases, that is a sign that lenders believe the risk of default on interbank loans (also known as counterparty risk) is increasing. Interbank lenders therefore demand a higher rate of interest, or accept lower returns on safe investments such as T-bills. When the risk of bank defaults is considered to be decreasing, the TED spread decreases.[2] The long term average of the TED has been 30 basis points with a maximum of 50 bps. During 2007, the subprime mortgage crisis ballooned the TED spread to a region of 150-200 bps. On September 17, 2008, the TED spread exceeded 300 bps, breaking the previous record set after the Black Monday crash of 1987.[3] Some higher readings for the spread were due to inability to obtain accurate LIBOR rates in the absence of a liquid unsecured lending market.[4]On October 10, 2008, the TED spread reached another new high of 465 basis points. (Wikipedia)
The current reading of .159% (and falling) is well within normal parameters and not showing the least sign of increasing interbank credit risk.
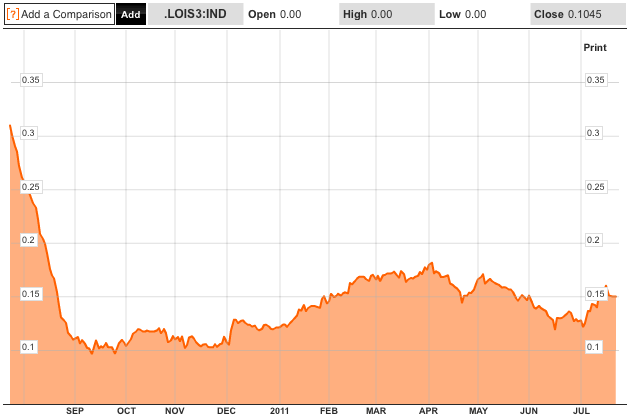
The Libor-OIS (LOIS) is the difference between LIBOR and the overnight indexed swap rate. The spread between the two rates is considered to be a measure of health of the banking system.
3-month LIBOR is generally floating rate of financing, which fluctuates depending on how risky a lending bank feels about a borrowing bank. The OIS is a swap derived from the overnight rate, which is generally fixed by the local central bank. The OIS allows LIBOR banks to borrow at a fixed rate of interest over the same period. In the United States the spread is based on the LIBOR Eurodollar rate and the Federal Reserve's Fed Funds rate.[2] LIBOR is risky in the sense that the lending bank loans cash to the borrowing bank, and the OIS is considered stableas both counterparties only swap the floating rate of interest for the fixed rate of interest. The spread between the two is therefore a measure of how likely borrowing banks will default. This reflects risk premiums in contrast to liquidity premiums. (Wikipedia)
At this time LOIS is showing no real signs of crisis or elevated risk.
If a financial meltdown resulting from sovereign credit risk were possible, probable, likely or imminent it seems that we should have seen this reflected in the interbank credit markets, and we have not. As further confirmation of this, the US Treasuries market has seen only modest pressure on the middle and long end of the term spectrum throughout this "crisis". Apparently investors, governments and financial entities worldwide concur that major systemic risks are not present at this time. On Friday, as equities markets tumbled, Treasuries spiked higher to levels not seen since December 2010.
I would not be surprised to see Treasuries spike even higher on a downgrade of US debt, but I might be looking to short that spike.
Naturally, traders need to be cognizant of risks to their capital and this is no time to fall asleep at the switch. But neither is it time to be excessively risk averse. The evidence seems to indicate that an important panic low buying opportunity may be imminent.
At this time I am going to conclude that a nearly six month long abcde triangle formation is in the process of being completed and that our benchmark SPX index is in the end stages of a significant correction. Below I have alternate Elliott Wave counts on the chart. In black I'm counting the beginning of a iii of (3) major bull wave and in red I'm counting the start of a v of (C) to complete a long term bear market D wave.
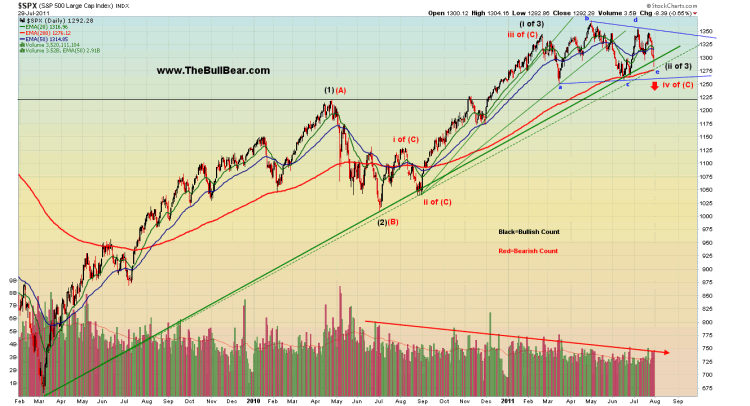
After extensive consideration, I would have to say that I would have to favor the conclusion that the entire move off of the March 2009 low is a massive D wave within the context of a long, sideways ABCDE triangle formation.
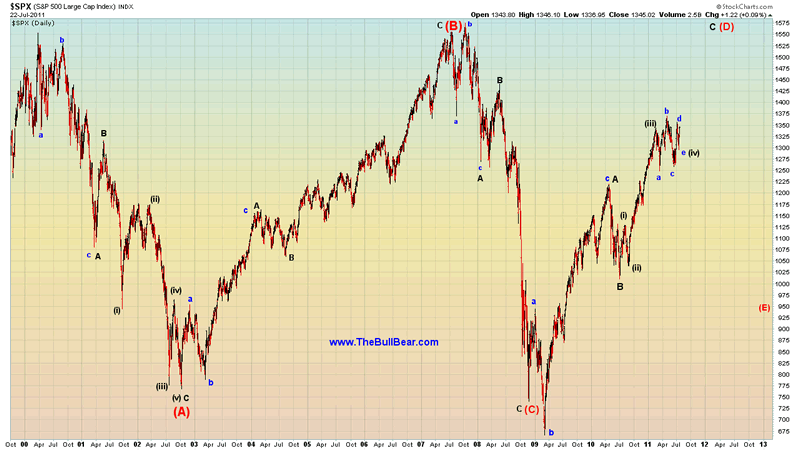
If so, a likely scenario is that the final wave of D completes in the vicinity of the B wave high as the temporary fix of the US and European sovereign debt crises unravels thereafter, prompting a partial E wave retracement to finally complete the bear market. At that point sentiment will have shifted to a bullish extreme and available sideline money will have been committed to the markets.
There are of course several long term bullish counts in which the move off the March 2009 low is the first wave of a new long term bull market and several long term bearish counts which favor the commencement of a bear market from current levels.
To read the full BullBear Market Report, please join us at BullBear Traders room at TheBullBear.com.
Disclosure: No current positions.
By Steve Vincent
Steven Vincent has been studying and trading the markets since 1998 and is a member of the Market Technicians Association. He is proprietor of BullBear Trading which provides market analysis, timing and guidance to subscribers. He focuses intermediate to long term swing trading. When he is not charting and analyzing the markets he teaches yoga and meditation in Los Angeles.
© 2011 Copyright Steven Vincent - All Rights Reserved Disclaimer: The above is a matter of opinion provided for general information purposes only and is not intended as investment advice. Information and analysis above are derived from sources and utilising methods believed to be reliable, but we cannot accept responsibility for any losses you may incur as a result of this analysis. Individuals should consult with their personal financial advisors.
© 2005-2022 http://www.MarketOracle.co.uk - The Market Oracle is a FREE Daily Financial Markets Analysis & Forecasting online publication.