


Stock Markets Headed Higher Into New Year
Stock-Markets / US Stock Markets Dec 01, 2007 - 02:47 PM GMTBy: Mike_Burk

The good news is: · It is likely we saw an intermediate term low last Monday.
Short Term : As of last Wednesday everything turned sharply upward. Most importantly, new lows all but disappeared on both the NYSE and NASDAQ. This implies a lower risk profile for the next month or two.
The chart below covers the past 100 trading days showing the S&P 500 (SPX) in blue and an indicator calculated by subtracting momentum of NYSE new lows from momentum of new highs in orange.
The indicator moved sharply upward last week in a pattern similar to what we saw last August.
Intermediate Term
The secondaries lead both up and down and, at least so far, they are not leading the up move that began last Tuesday.
The chart below is from FastTrack ( http://fasttrack.net/ ), it covers the past year showing the SPX in red, the Russell 2000 (R2K) in green and a relative strength indicator called Accutrack (AT) as a histogram in yellow.
AT indicates the R2K has been underperforming the SPX since last May and continued to do so last week.
The rapid decrease in new lows suggests we have seen a short term bottom, but, the extreme number of new lows at or near the bottom and the continued underperformance of the secondaries relative to the blue chips is indicative of a large developing top.
Seasonality
Next week includes the first 5 trading days in December during the 3 rd year of the Presidential Cycle.
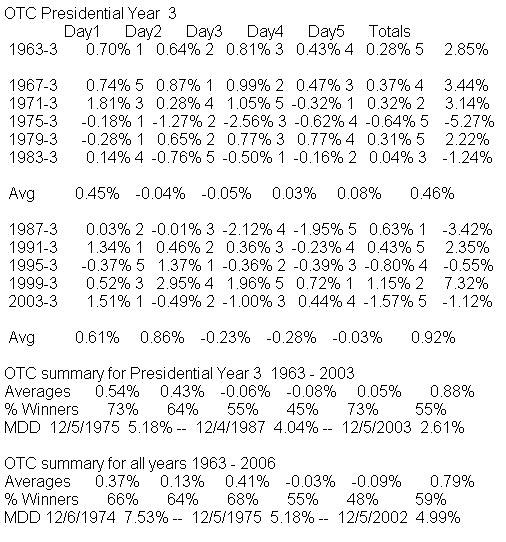
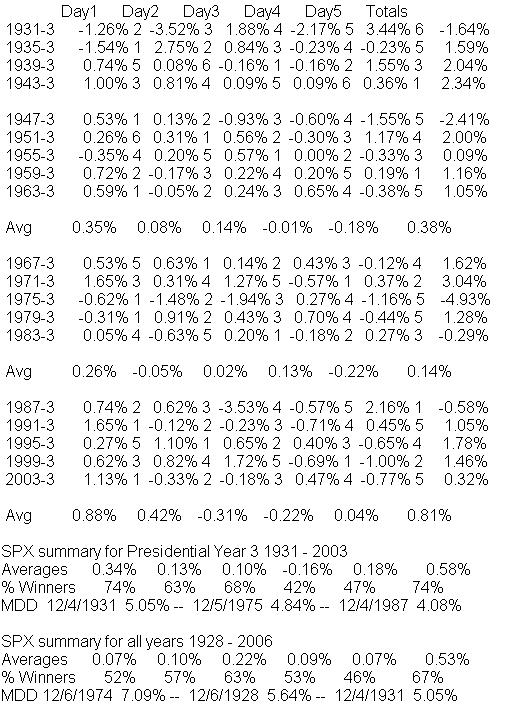
The tables show the daily change of the NASDAQ composite (OTC) and SPX during the last 5 trading days of December during the 3 rd year of the Presidential Cycle. OTC data covers the period from 1963 – 2003 and SPX data from 1928 – 2003. There are summaries for both the 3 rd year of the Presidential Cycle and all years combined.
Historically this has been volatile week. In 1975 the OTC was down 5.27%% and in 1999 it was up 7.32%.
On average the week has been modestly positive by all measures. The OTC has been up a little more than half of the time while the SPX has been up about 2/3's of the time.
First 5 days of December.
The number following the year represents its position in the presidential cycle.
The number following the daily return represents the day of the week;
1 = Monday, 2 = Tuesday etc.
OTC Presidential Year 3
SPX Presidential Year 3
Money supply
This M2 money supply chart has been provided by Gordon Harms.
Mutual Fund
Compliance issues demand that I not mention the mutual fund that I manage by name or symbol in this letter.
To see a current chart of the fund go to:
http://finance.yahoo.com/q/bc ?s=APHAX&t=6m&l=on&z=m&q=l&c =
For information about the fund go to: http://www.thealphafunds.com /index.htm
The fund now has service class shares available.
December
December has been one of the better months for the market.
Since 1928 the SPX has been up 75% of the time in December with an average gain of 1.4%. During the 3 rd year of the Presidential Cycle the performance has been even better up 84% of the time with an average gain of 2.3%.
The OTC has been a little more volatile, it has been up 61% of the time in December with an average gain of 1.5% and during the 3 rd year of the Presidential Cycle up 73% of the time with an average gain of 4.9%. The average was helped noticeably by a 21.3% gain in 1999.
The charts below show the daily averages for December for all years and for the 3 rd year of the Presidential Cycle. The average month has 21 trading days and the charts have been calculated by averaging the daily return for the first 11 trading days and the last 10. If the month had more than 21 trading days some of the days in the middle were ignored and if it had less than 21 trading days some of the days in the middle were counted twice. Dashed vertical lines have been drawn after the 1 st trading day and at 5 day intervals after that. A solid vertical line has been drawn on the 11 th trading day, the dividing point.
The 1 st chart shows the OTC average for all years in blue and the average for the 3 rd year of the Presidential Cycle in green.

The next chart is similar to the one above except it uses SPX data.
Conclusion
The market is at the beginning of an up move that should last a couple months.
I expect the major indices to be higher on Friday December 7 than they were on Friday November 30.
Last weeks negative forecast was a miss.
Thank you,
By Mike Burk
To subscribe to this report : http://alphaim.net/signup.html
Disclaimer: Mike Burk is an employee and principal of Alpha Investment Management (Alpha) a registered investment advisor. Charts and figures presented herein are believed to be reliable but we cannot attest to their accuracy. Recent (last 10-15 yrs.) data has been supplied by CSI (csidata.com), FastTrack (fasttrack.net), Quotes Plus (qp2.com) and the Wall Street Journal (wsj.com). Historical data is from Barron's and ISI price books. The views expressed are provided for information purposes only and should not be construed in any way as investment advice. Furthermore, the opinions expressed may change without notice.
Mike Burk Archive |
© 2005-2022 http://www.MarketOracle.co.uk - The Market Oracle is a FREE Daily Financial Markets Analysis & Forecasting online publication.