


U.S. Payroll Stunner, Full "Pathetic" Jobs Report Analysis
Economics / Employment Jul 08, 2011 - 02:05 PM GMTBy: Mike_Shedlock

 Thoughts on the Jobs Report
Last month I commented things are awful at first glance and simply bad beneath the surface. This month things took a huge turn for the worse.
Three months ago I commented "It is very questionable if this pace of jobs keeps up." Clearly it didn't, for the second straight disastrous month. Certainly this cannot all be blamed on the Tsunami in Japan. The entire global economy is slowing rapidly as I have commented numerous times.
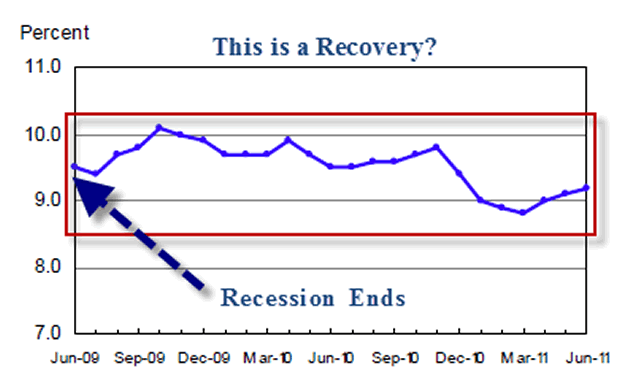
Economists projected a drop in the unemployment rate, I called for a rise to 9.2%.
Few were prepared for today's grim numbers.
- US Payrolls +18,000
- Last Month Quietly Revised Lower to +25,000 from +54,000
- US Unemployment Unexpectedly Rises +.1 to 9.2% Despite Drop in Participation Rate
- Since March, Number of Unemployed Rises by 545,000
- Household Survey Number Unemployed Up 173,000
- Household Survey Number of Employed Down 445,000
- 272,000 people dropped out of the labor force, reversing the labor force gain of 272,000 last month.
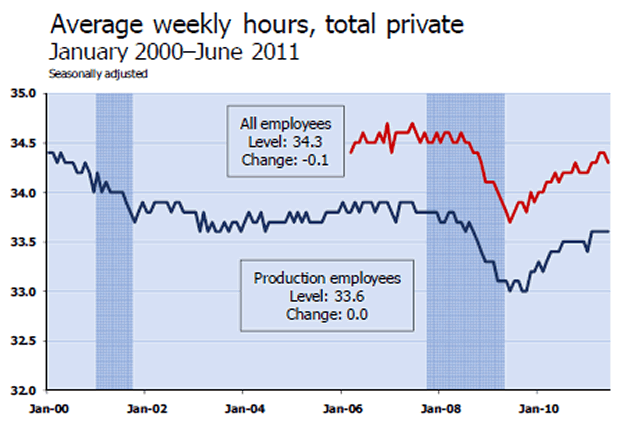
- Average Weekly Workweek Drops by .1 Hours
- Average Manufacturing Hours Drops by .3 Hours
- Average Private Hourly Earnings Decrease 1 Cent
- There has been virtually no improvement in part-time employment in a full year. 8.5+ million workers want a full time job and cannot find one.
Recall that the unemployment rate varies in accordance with the Household Survey not the reported headline jobs number, and not in accordance with the weekly claims data.
Digging deeper into the Household Survey, we see some more interesting data. In the last year, the civilian population rose by 1,799,000. Yet the labor force dropped by 263,000. Those not in the labor force rose by 2,063,000.
Last month the labor force rose by 272,000. This month the labor force fell by 272,000. How's that for symmetry?
The 6-month labor force total for 2011 is +4,000.
Many of those millions who dropped out of the workforce would start looking if they thought jobs were available. Indeed, in a 2-year old recovery, the labor force should be rising sharply as those who stopped looking for jobs, once again started looking. Instead, the labor force is not expanding at all.
Were it not for people dropping out of the labor force for the past two years, the unemployment rate would be well over 11%.
June 2011 Jobs Report
Please consider the Bureau of Labor Statistics (BLS) June 2011 Employment Report.
Nonfarm payroll employment was essentially unchanged in June (+18,000), and the unemployment rate was little changed at 9.2 percent, the U.S. Bureau of Labor Statistics reported today. Employment in most major private-sector industries changed little over the month. Government employment
continued to trend down.
Unemployment Rate - Seasonally Adjusted
Nonfarm Employment - Payroll Survey - Annual Look - Seasonally Adjusted
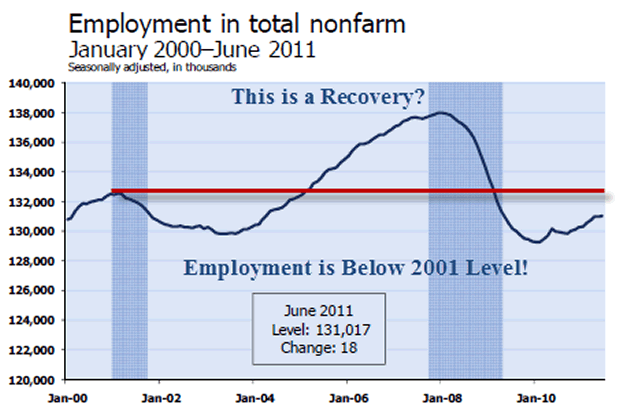
Notice that employment is lower than it was 10 years ago.
Nonfarm Employment - Payroll Survey - Monthly Look - Seasonally Adjusted
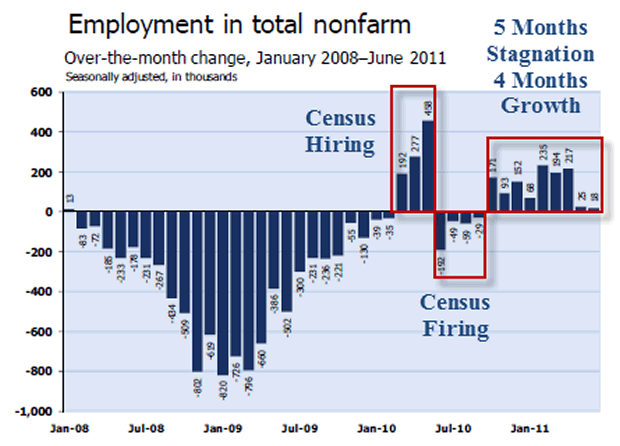
Between January 2008 and February 2010, the U.S. economy lost 8.8 million jobs.
Ignoring the effects of the census, in the last 9 months of a recovery 2 years old, the economy is averaging 130,000 jobs a month. That is very poor as recoveries go.
Statistically, 127,000 jobs a month is enough to keep the unemployment rate flat.
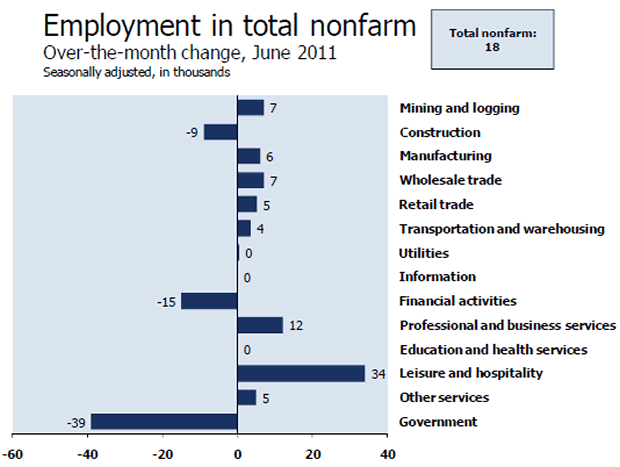
Nonfarm Employment - Payroll Survey Details - Seasonally Adjusted
Average Weekly Hours
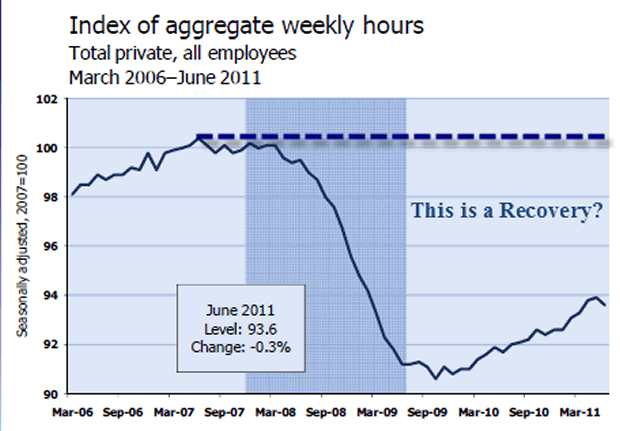
Index of Aggregate Weekly Hours
Average Hourly Earnings vs. CPI
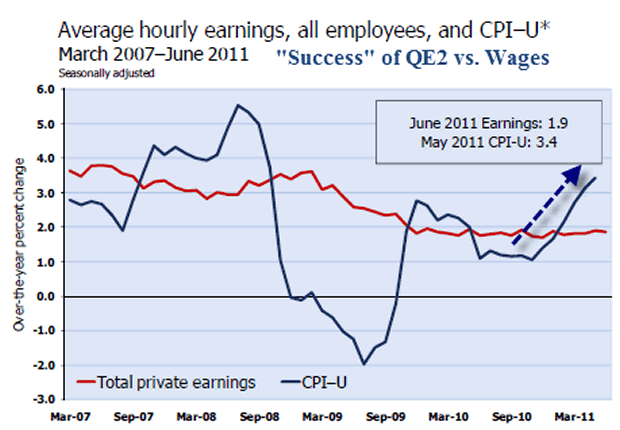
"Success" of QE2
- Average hourly earnings of all private-sector employees declined by 1 cent in
June to $22.99; over the year, the series has increased 1.9 percent.
- The consumer price index for all urban consumers (CPI-U) was up 3.4 percent
over the year ending in May.
Not only are wages rising slower than the CPI, there is also a concern as to how those wage gains are distributed.
BLS Birth-Death Model Black Box
The BLS Birth/Death Model is an estimation by the BLS as to how many jobs the economy created that were not picked up in the payroll survey.
The BLS has moved to quarterly rather than annual adjustments to smooth out the numbers.
For more details please see Introduction of Quarterly Birth/Death Model Updates in the Establishment Survey
In recent years Birth/Death methodology has been so screwed up and there have been so many revisions that it has been painful to watch.
The Birth-Death numbers are not seasonally adjusted while the reported headline number is. In the black box the BLS combines the two coming out with a total.
The Birth Death number influences the overall totals, but the math is not as simple as it appears. Moreover, the effect is nowhere near as big as it might logically appear at first glance.
Do not add or subtract the Birth-Death numbers from the reported headline totals. It does not work that way.
Birth/Death assumptions are supposedly made according to estimates of where the BLS thinks we are in the economic cycle. Theory is one thing. Practice is clearly another as noted by numerous recent revisions.
Birth Death Model Adjustments For 2011
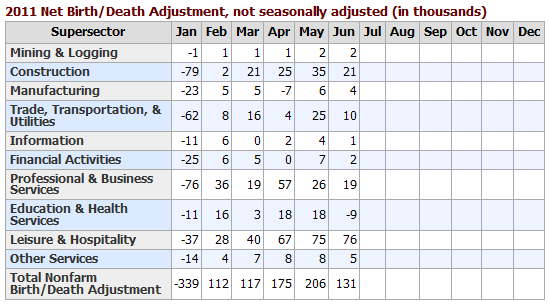
BLS Back in Outer-Space
Do NOT subtract 131,000 from the headline number. That is statistically invalid. However, in my estimation the BLS is back in outer-space.
It is clear the economy is slowing and the BLS model has not picked it up. The model is horrendously wrong at economic turns.
Household Data
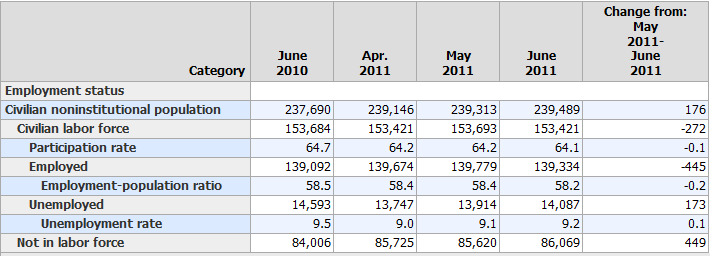
In the last year, the civilian population rose by 1,799,000. Yet the labor force dropped by 263,000. Those not in the labor force rose by 2,063,000.
Last month the labor force rose by 272,000.
Were it not for people dropping out of the labor force, the unemployment rate would be well over 11%.
Table A-8 Part Time Status
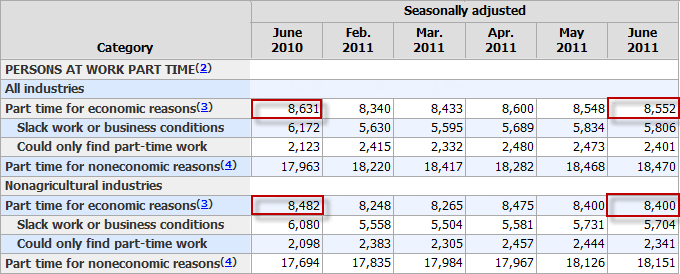
There has been virtually no improvement in part-time employment in a full year. 8.5+ million workers want a full time job and cannot find one.
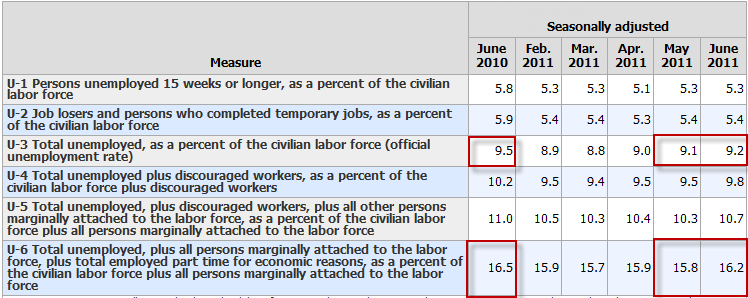
Table A-15
Table A-15 is where one can find a better approximation of what the unemployment rate really is.
Distorted Statistics
Given the total distortions of reality with respect to not counting people who allegedly dropped out of the work force, it is hard to discuss the numbers.
The official unemployment rate is 9.2%. However, if you start counting all the people that want a job but gave up, all the people with part-time jobs that want a full-time job, all the people who dropped off the unemployment rolls because their unemployment benefits ran out, etc., you get a closer picture of what the unemployment rate is. That number is in the last row labeled U-6.
While the "official" unemployment rate is an unacceptable 9.2%, U-6 is much higher at 16.2%.
Things are much worse than the reported numbers would have you believe, and for the second consecutive month the beneath the surface numbers were bad-to-awful.
Note that U3 rose from 9.1% to 9.2% while U6 rose from 15.8% to 16.2%. Thus, the official measure rose .1, while the alternative measure rose .4.
This is an "artifact" of 272,000 people dropping out of the labor force this past month.
Also note that the unemployment rate is barely better than it was a year ago. It would actually be worse than a year ago were it not for people dropping out of the labor force.
This was a pathetic jobs report
By Mike "Mish" Shedlock
http://globaleconomicanalysis.blogspot.com Click Here To Scroll Thru My Recent Post List
Mike Shedlock / Mish is a registered investment advisor representative for SitkaPacific Capital Management . Sitka Pacific is an asset management firm whose goal is strong performance and low volatility, regardless of market direction.
Visit Sitka Pacific's Account Management Page to learn more about wealth management and capital preservation strategies of Sitka Pacific.
I do weekly podcasts every Thursday on HoweStreet and a brief 7 minute segment on Saturday on CKNW AM 980 in Vancouver.
When not writing about stocks or the economy I spends a great deal of time on photography and in the garden. I have over 80 magazine and book cover credits. Some of my Wisconsin and gardening images can be seen at MichaelShedlock.com .
© 2011 Mike Shedlock, All Rights Reserved.
© 2005-2022 http://www.MarketOracle.co.uk - The Market Oracle is a FREE Daily Financial Markets Analysis & Forecasting online publication.