


Crude Oil Price Could Double
Commodities / Crude Oil Jul 04, 2011 - 04:12 AM GMTBy: Tony_Caldaro

 We have not written anything about the bull market in Crude since November. And that piece was more directed toward Natual Gas, which continues to drift along with a slight upward bias. We are not going to get into the fundamentals that are driving Crude prices higher; i.e. peak oil, quantitative easing, tax issues and simply growing energy demand from the emerging economies. This is more of a technical report using the principles of OEW with price and cycle analysis.
Commodities move in 34 year cycles: 13 years up and 21 years down. The reason this occurs has a lot to do with FED policy, the 68 year interest rate cycle and the 34 year currency cycle. The bellwether for this 13 year cycle is Gold, which bottomed in 2001. A search on selected charts or special reports, on this website, will produce some additional information about these cycles.
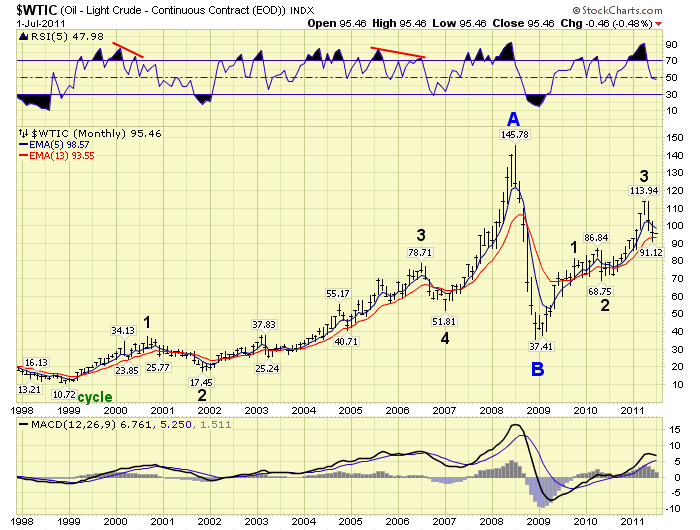
Typically commodities experience an ABC type bull market. Commodities are mainly driven by supply/demand, while stock markets are mainly driven by economic growth. The only exception to an ABC commodity bull market, that we are aware of, is Gold and Silver. The following chart displays the price action in Crude since the 1998 low at about $11.00. Notice the five Major wave advance from 1998 to 2008: $11.00 – $146.00. This completed Primary wave A of this Cycle wave bull market. Next came the collapse in the world’s economy in 2008. Crude dropped, in a matter of months, down to $35.00. This was Primary wave B. The prices quoted are daily closing prices in a continuous contract. Since that 2008 low, Crude has been advancing in another five Major waves. When these five waves conclude, probably around 2014, Crude will have completed its entire bull market in an ABC consisting of three Primary waves.
Recently Crude hit a high of $114 to end Major wave 3. Then sold off sharply down to a June low of $91. This recent low may have ended Major wave 4. It was sufficiently oversold on the weekly RSI, and nearly so on the weekly MACD, (we like to see the MACD touch neutral during major corrections). If the low is indeed in we can now make some fibonacci calculations, which should produce resistance levels, for the rest of the bull market.
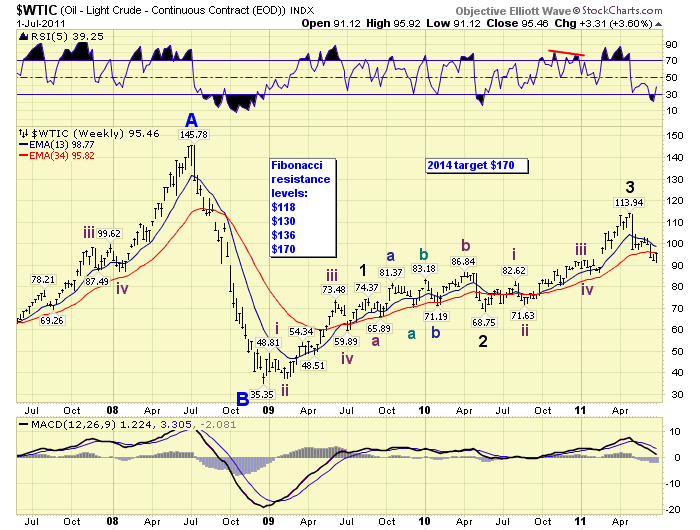
First, Primary wave A rose $135: at $118 Primary C = 0.618 times Primary A, then at $170 Primary C equals Primary A. Second, Major wave 1 was $39 and Major wave 3 was $45. At $130 Major wave 5 equals Major wave 1. At $136 Major wave 5 equals Major wave 3. Then at $170 Major wave 5 equals Major wave 1 through 3. This analysis suggests future resistance at the following levels: $118, $130, $136 and then a cluster at $170. Therefore, we expect Crude will end its bull market at $170 on the continuous contract closing price basis. It could shoot up to $180 on an intraday basis, the reason for the potential double.
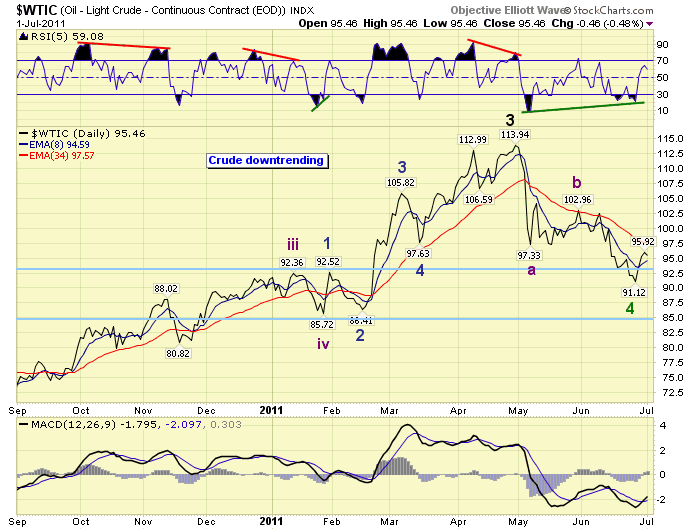
The above chart displays the daily price action since September 2010. Notice the negative RSI divergences at short term and medium term tops, plus the positive divergences at medium term lows. You can observe this correction was much steeper, and more complex, than Intermediate wave iv in January. Also the decline came right into an important support zone between Intermediate waves iii and iv. Then at the recent low we had a positive divergence between Intermediate wave A (May) and Intermediate wave C (June). This is a classic bottoming pattern in OEW analysis.
CHARTS: http://stockcharts.com/...
http://caldaroew.spaces.live.com
After about 40 years of investing in the markets one learns that the markets are constantly changing, not only in price, but in what drives the markets. In the 1960s, the Nifty Fifty were the leaders of the stock market. In the 1970s, stock selection using Technical Analysis was important, as the market stayed with a trading range for the entire decade. In the 1980s, the market finally broke out of it doldrums, as the DOW broke through 1100 in 1982, and launched the greatest bull market on record.
Sharing is an important aspect of a life. Over 100 people have joined our group, from all walks of life, covering twenty three countries across the globe. It's been the most fun I have ever had in the market. Sharing uncommon knowledge, with investors. In hope of aiding them in finding their financial independence.
Copyright © 2011 Tony Caldaro - All Rights Reserved Disclaimer: The above is a matter of opinion provided for general information purposes only and is not intended as investment advice. Information and analysis above are derived from sources and utilising methods believed to be reliable, but we cannot accept responsibility for any losses you may incur as a result of this analysis. Individuals should consult with their personal financial advisors.
© 2005-2022 http://www.MarketOracle.co.uk - The Market Oracle is a FREE Daily Financial Markets Analysis & Forecasting online publication.