


Stock Market Correction Continues
Stock-Markets / Stock Markets 2011 Jun 25, 2011 - 04:00 PM GMTBy: Tony_Caldaro

 Another volatile week that ended about where it started. Economic reports were light and mixed: 5 negative/4 positive. On the negative side: existing/new home sales fell, as did the M1-multiplier and the WLEI. Weekly jobless claims ticked up. On the positive side: Q1 GDP was revised upward, durable good orders rose, along with the monetary base and the FHFA housing index. For the week the SPX/DOW were -0.40%, and the NDX/NAZ were +1.25%.
Asian markets rallied 2.4%, while European markets fell 1.7%. The Commodity equity group lost 0.2%, and the DJ World index slipped 0.1%. The eastern markets are now displaying some strength while western markets remain weak. This is exactly the opposite of what occurred when this downtrend began. Next week will be highlighted by PCE prices, the Case-Shiller housing index and the Chicago PMI.
LONG TERM: bull market
We continue to count this long term uptrend as an ongoing bull market from the March 2009 SPX 667 low. While this market has run into some resistance in the SPX 1300′s, it’s not unusual after a doubling in just under two years. Even the 2002-2007 bull market got off to a strong start, then ran into resistance in the SPX 1200′s during 2005 before breaking out to complete its pattern. We see similar activity in this market this year. The indicators we track on the weekly chart are still positive and even oversold: MACD heading towards neutral, and RSI oversold.
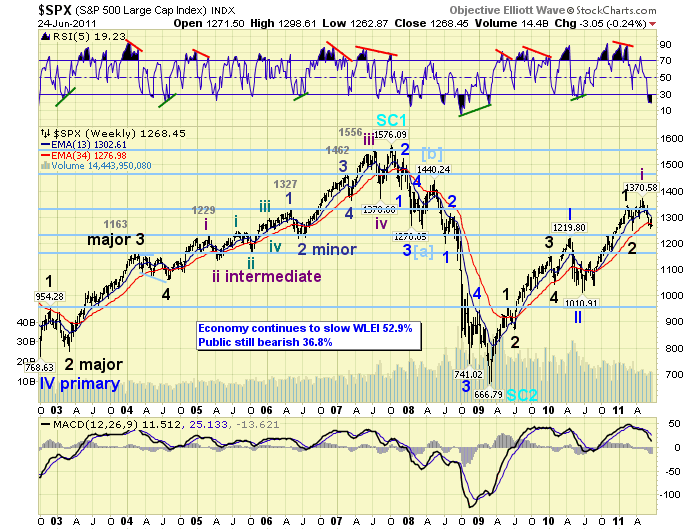
The OEW count we have been tracking remains bullish. Primary waves I and II completed in April and July 2010, and Primary wave III has been underway ever since. Primary I divided into five Major waves and Primary III appears to be doing the same, with a slight variation. After this correction concludes Major wave 3 should be underway.
MEDIUM TERM: downtrend low SPX 1258
After the February SPX 1344 uptrend high we had a simple 7.1% zigzag correction into the March SPX 1249 downtrend low. The market appeared to be ready to kickoff Major wave 3 of Primary III. The uptrend certainly started with those intentions. A quick rally to SPX 1339 in about three weeks, a two week pullback to 1295, then a two week rally to 1371. After three waves up, commodities sold off in the first week of May and there was weakness in eastern markets, then the uptrend appeared to breakdown. Since we’re in a bull market we continued to give the uptrend the benefit of doubt. But after the OEW downtrend confirmation we knew the market was heading lower.
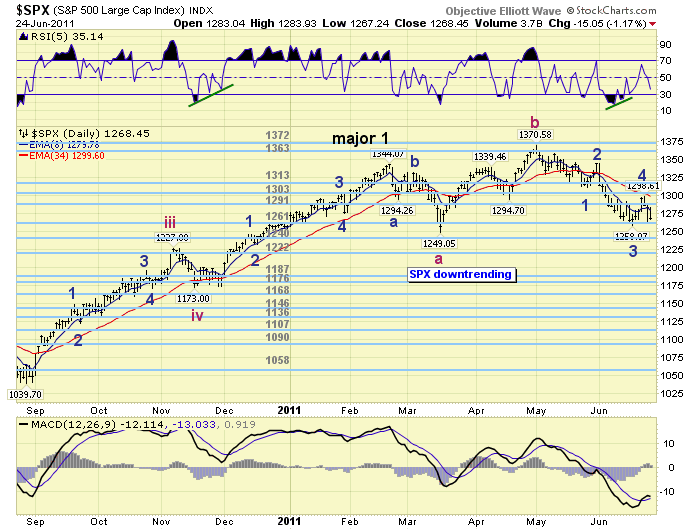
With the three wave decline Feb-Mar, then the three wave advance Mar-May, the obvious count would be an irregular flat – a double bottom with the March low at SPX 1249. At first we expected an irregular complex correction (3-3-3) with the potential low at SPX 1258. After a swift rally to SPX 1299, the best rally of the downtrend, the market rolled over yet again to finish the week at 1268. Since the rally appears corrective we decided to upgrade the count from an ABC downtrend to a five wave downtrend. This five waves would complete an irregular (3-3-5) flat, likely around the March SPX 1249 low.
SHORT TERM
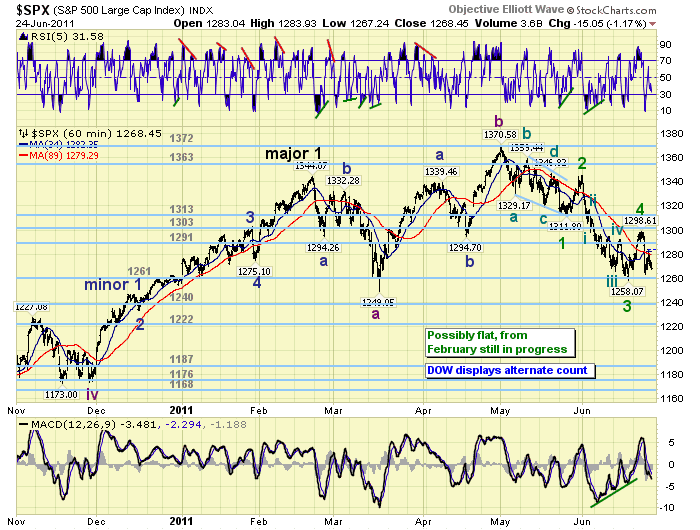
Support for the SPX remains at 1261 and then 1240, with resistance at 1291 and then 1303. Short term momentum ended the week heading toward oversold after a brief pop over neutral on thursday. The short term pattern suggests the market is currently in Minor wave 5 of Intermediate wave C of an irregular Major wave 2 correction. Since nothing like this has occurred before, during this two plus year bull market, it has been a bit difficult to track. The obvious short term count continues to evolve into another count. Such was the situation during the Mar-May uptrend, and now the May-Jun downtrend. Anticipate-monitor-adjust.
The key levels to watch going forward are the OEW 1261 and 1240 pivots on the downside, and the OEW 1303 and 1313 pivots on the upside. The area of heavy resistance on the upside has been the OEW 1291 pivot for the entire month of June. This pivot was also suport for the A wave during the Feb-Mar ABC downtrend, and the B wave support for the Mar-May ABC uptrend. It is now resistance for this apparently five wave downtrend.
When this downtred does make its low, which will probably be in the next week or so. We would expect a sharp spike up rally clearing the OEW 1291 pivot and the 1303/1313 pivots as well. Some positive divergences on the daily and lesser timeframe charts, to accompany the oversold weekly chart, would be fitting. Best to your trading!
FOREIGN MARKETS
Asian markets were all higher on the week for a net gain of 2.4%. Most have bounced off their recent lows but none have confirmed uptrends yet.
European markets were all lower on the week for a net loss of 1.7%. All remain in downtrends here as well.
The Commodity equity group was mixed on the week for a net loss of only 0.2%.
The downtrending DJ World index lost only 0.1%.
COMMODITIES
Bonds continue their uptrend gaining 0.7% on the week. The 10YR yield closed under 2.9%, and the 1YR is at a record low 0.15%. The FED certainly has control of this market.
Crude ended the week quite well considering the move by the DOE to increase supply in the US. Downtrending Crude lost 1.3% on the week and has entered our $85-$93 support zone.
Gold looks like it’s rolling over again, after a choppy uptrend, losing 2.4% on the week.
The USD continues to uptrend gaining 0.9% on the week. It’s entering our resistance zone of DXY 77-79.
NEXT WEEK
A somewhat busy week ahead economically. On monday, at 8:30, Personal income/spending and PCE prices. On tuesday we have Case-Shiller and Consumer confidence. On wednesday, Pending home sales, and then on thursday weekly Jobless claims and the Chicago PMI. On friday we close out the week with Consumer sentiment, ISM manufacturing, Construction spending and the monthly Auto sales. The FED has only one speech scheduled. FED governor Raskin gives a speech in Wash, DC on wednesday. Best to you and yours this weekend and week.
CHARTS: http://stockcharts.com/...
http://caldaroew.spaces.live.com
After about 40 years of investing in the markets one learns that the markets are constantly changing, not only in price, but in what drives the markets. In the 1960s, the Nifty Fifty were the leaders of the stock market. In the 1970s, stock selection using Technical Analysis was important, as the market stayed with a trading range for the entire decade. In the 1980s, the market finally broke out of it doldrums, as the DOW broke through 1100 in 1982, and launched the greatest bull market on record.
Sharing is an important aspect of a life. Over 100 people have joined our group, from all walks of life, covering twenty three countries across the globe. It's been the most fun I have ever had in the market. Sharing uncommon knowledge, with investors. In hope of aiding them in finding their financial independence.
Copyright © 2011 Tony Caldaro - All Rights Reserved Disclaimer: The above is a matter of opinion provided for general information purposes only and is not intended as investment advice. Information and analysis above are derived from sources and utilising methods believed to be reliable, but we cannot accept responsibility for any losses you may incur as a result of this analysis. Individuals should consult with their personal financial advisors.
© 2005-2022 http://www.MarketOracle.co.uk - The Market Oracle is a FREE Daily Financial Markets Analysis & Forecasting online publication.