


Stock Markets To Decline Towards Tradeable Bottom During the Week
Stock-Markets / US Stock Markets Nov 25, 2007 - 10:28 AM GMTBy: Mike_Burk

The good news is: · The market is near a tradable low.
Short Term As of last Wednesday the Russell 2000 (R2K) was down for 6 consecutive days for the first time since July 2006 and for only the 4 th time in the last 5 years. This is an oversold condition that usually occurs near the beginning and end of bear markets.
The charts below show the how oversold the market is by another measure, the percentage of the component issues in an index that are above their 50 day EMA's.
The first chart covers the past year showing the S&P 500 (SPX) in red and the percentage of the component issues of the SPX that are above their 50 day EMA's in olive drab. Dashed vertical lines have been drawn on the 1 st trading day of each month and dashed horizontal lines have been drawn at 25% intervals for the indicator.
The indicator fell from its early October high of 81% to an oversold low of 25% last Wednesday. The indicator rose to 29% on Friday, but Friday was a throw away day as far as indicators are concerned.
The next chart is similar to the one above except it shows the R2K and the percentage of its component issues above their 50 day EMA.
Short term the market is oversold.
Intermediate Term
When the market hits a low with a high number of new lows (let's say more than 400) there is usually a retest of that low a month or two later. If there is a high number of new lows on the retest, another dip in prices is likely.
The chart below covers the past year showing the SPX in red and a 10% trend (19 day EMA) of NYSE new lows (NY NL) in black. NY NL has been plotted on an inverted Y axis so increasing new lows moves the indicator downward (up is good).
Last Tuesday there were 613 new lows on the NYSE and the value of the indicator on Friday was 296. These numbers are high enough to suggest the another retest.
The next chart shows how the indicator behaved during the 2002 – 2003 bottom. The highest value recorded for the indicator in the 2002 – 2003 period was 318 while the highest value recorded last August was 433.
Last August 16 the NYSE reported 1132 new lows, the 3 rd highest ever while the NASDAQ reported “only” 338 new lows on that date. Recently the NASDAQ has been reporting more new lows than it did last August and that is reflected in the new low indicator calculated from NASDAQ data.
The chart below covers the past year showing the NASDAQ composite (OTC) in blue and a 10% trend of NASDAQ new lows (OTC NL) in red.
Last week OTC NL matched its August lows.
There is no evidence of a bottom.
The market may rally from here, but another retest is likely.
Seasonality
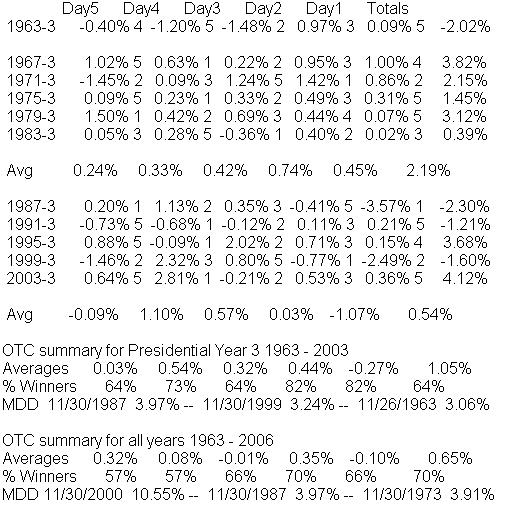
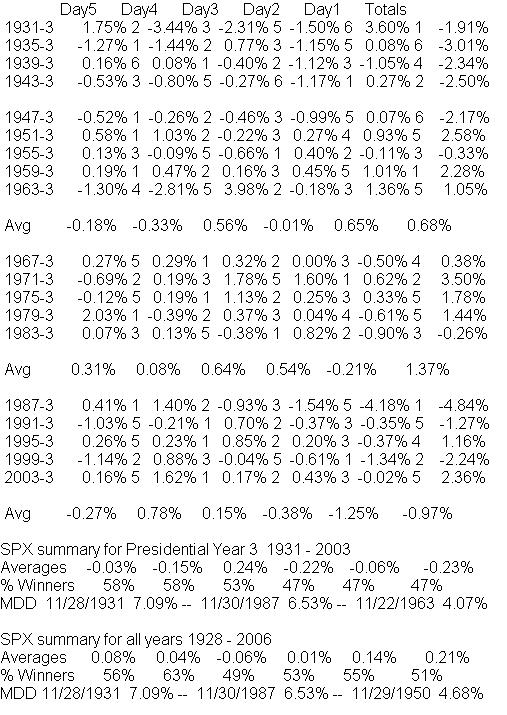
Next week includes the last 5 trading days in December during the 3 rd year of the Presidential Cycle.
The tables show the daily change of the OTC and S&P 500 (SPX) during the last 5 trading days of December during the 3 rd year of the Presidential Cycle. OTC data covers the period from 1963 – 2003 and SPX data from 1928 – 2003. There are summaries for both the 3 rd year of the Presidential Cycle and all years combined.
Historically this has been a week of extremes. In 1971 the SPX was up 3.50% and in 1987 the SPX was down 4.84%. By any measure the SPX has been up about half of the time with on, on average, very modest gains and losses. The OTC with its shorter history has been better, up about 2/3 of the time with, on average, solid gains.
Last 5 days of November
The number following the year represents its position in the presidential cycle.
The number following the daily return represents the day of the week;
1 = Monday, 2 = Tuesday etc.
OTC Presidential Year 3
SPX Presidential Year 3
Mutual Fund
Compliance issues demand that I not mention the mutual fund that I manage by name or symbol in this article.
To see a current chart of the fund go to: http://finance.yahoo.com/q/bc ?s=APHAX&t=6m&l=on&z=m&q=l&c =
For information about the fund go to: http://www.thealphafunds.com /index.htm
The fund now has service class shares available.
Conclusion
The market is oversold, but with the high number of new lows and the secondaries leading the way down there is likely to be another leg down before a tradable rally.
I expect the major indices to be lower on Friday November 30 than they were on Friday November 23.
Last weeks positive forecast based on a seasonal rally from an oversold condition was a miss.
Thank you,
By Mike Burk
To subscribe to this report : http://alphaim.net/signup.html
Disclaimer: Mike Burk is an employee and principal of Alpha Investment Management (Alpha) a registered investment advisor. Charts and figures presented herein are believed to be reliable but we cannot attest to their accuracy. Recent (last 10-15 yrs.) data has been supplied by CSI (csidata.com), FastTrack (fasttrack.net), Quotes Plus (qp2.com) and the Wall Street Journal (wsj.com). Historical data is from Barron's and ISI price books. The views expressed are provided for information purposes only and should not be construed in any way as investment advice. Furthermore, the opinions expressed may change without notice.
Mike Burk Archive |
© 2005-2022 http://www.MarketOracle.co.uk - The Market Oracle is a FREE Daily Financial Markets Analysis & Forecasting online publication.