


Stock Market Has Possibly Bottomed
Stock-Markets / Stock Markets 2011 Jun 18, 2011 - 11:09 AM GMTBy: Tony_Caldaro

 A volatile week in the US which ended about where it started: SPX/DOW +0.2%. On the economic front positive reports edged out negative ones 9:8. On the positive side: the PPI/CPI remained positive, along with business inventories and industrial production. Improving were housing starts, building permits, weekly jobless claims, leading indicators and the monetary base. On the negative side: capacity utilization, the NAHB housing index, consumer sentiment and the WLEI all turned lower.
Turning negative were retail sales, the NY/Philly FED, and the current account deficit increased. As for the markets. The SPX/DOW were +0.2%, but the NDX/NAZ were -1.2%. Asian markets lost 2.2%, the Commodity equity group lost 2.5%, the DJ World index lost 0.9%, but European markets were up 0.6%. Bonds gained 0.2%, Crude tumbled 6.4%, Gold rose 0.3% as did the USD. Next week we have the FOMC meeting, Q1 GDP and Durable goods orders.
LONG TERM: bull market
In about two months we will have completed our sixth year publishing a blog on the internet. It has been quite interesting. We have had a bull market, then a real nasty bear market, followed by another bull market. For the entire period some EW’ers have remained bearish and many of these have stopped publishing. Some labeled the 2002-2007 bull market as a bear market rally. Just like they are labeling the 2009-2011 bull market as a bear market rally. They did, however, get the 2007-2009 bear market right.
Our record speaks for itself and is documented right here on this blog. When we started in Aug 2005 we were bullish. We remained bullish until January 2008 and turned bearish. We stayed bearish until March 2009 and then projected a 50% rally. When the rally unfolded and then failed to collapse we turned bullish in early 2010, and have remained bullish ever since. The Elliott Wave works! It should! Afterall it tracks investor sentiment as it unfolds. But one has to be objective, and OEW does that for us. The objective is to track the market, quantify the waves, and project the most probable outcome. OEW does that for us too! Project, monitor and adjust.
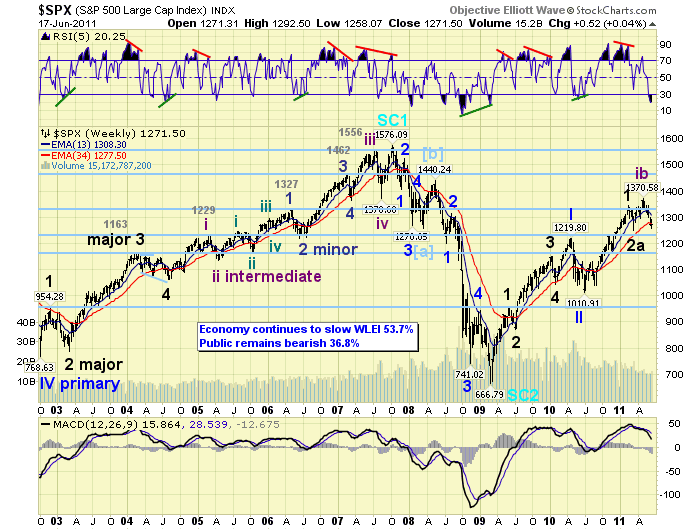
The weekly chart above speaks for itself. During bull markets the MACD stays above neutral, and then turns and remains negative during bear markets. The RSI constantly hits extremely overbought during bull markets, and extremely oversold during bear. The waves patterns are impulsive five wave structures during bull markets, and corrective three wave structures during bear. With these parameters alone one can easily see we are still in a bull market.
MEDIUM TERM: downtrend low SPX 1258
During bull markets and bear the market unfolds in trends. These trends are the significant waves. These are the waves that are labeled in the weekly chart to track the long term bullish/bearish trend. Yes, bull and bear markets are also trends, but long term trends. Which happens to be the name of a newsletter we published in the late 1980′s: Long-Term Trends.
The current trend/wave has been down, and has been underway since May 2nd when the SPX hit 1371 on the “Osama bin Laden is dead” news. That week commodities collapsed, Crude and Silver especially, and this eventually spilled over into the world’s equity markets. Then the negative news, which was ignored during the previous uptrends, was now big news during the downtrend. Fear begats fear, greed ignores fear. Love conquers fear. But that is another subject entirely.
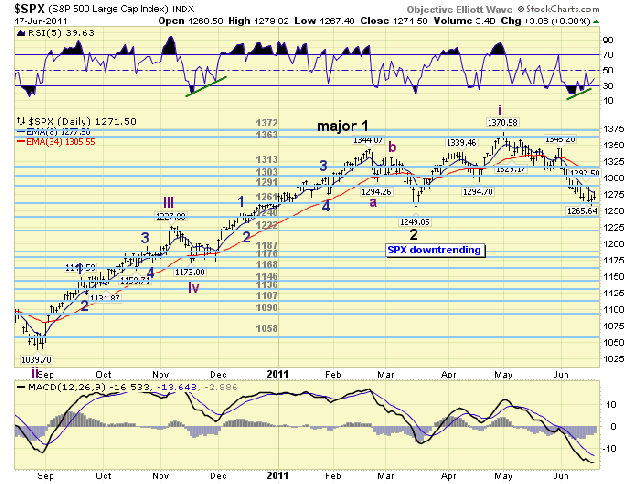
This downtrend can best be described as part of an ongoing correction from the February SPX 1344 high. Yes, the market did make a new bull market high in April/May and this can occur in EW with what we term an irregular correction. Irregular corrections occur during strong markets. The correction unfolds in a complex ABC, but the B wave reaches a point that is higher than the start of the A wave. The C wave eventually concludes the entire correction usually in a flat (double bottom with waves A and C) and occassionally in a zigzag (when the C wave drops well below the end of the A wave). We believe this correction will end is the usual formation: a double bottom flat.
When we examine this February to June correction, which btw followed a well extended seven month uptrend from July 2010 to February 2011, (SPX 1011 to 1344). We observe the A wave down (Feb-Mar SPX 1344-1249) took the form of a zigzag. The uptrending B wave (Mar-May SPX 1249-1371) also took the form of a zigzag. Now the current downtrending C wave is also taking the form of another zigzag. This is termed an irregular complex correction, or an irregular double three. When this correction concludes the bull maret should resume to our projected target close to, or exceeding, the all time high at SPX 1576 by 2012. This lengthy correction has pushed out our timing from early 2012 to some time in 2012.
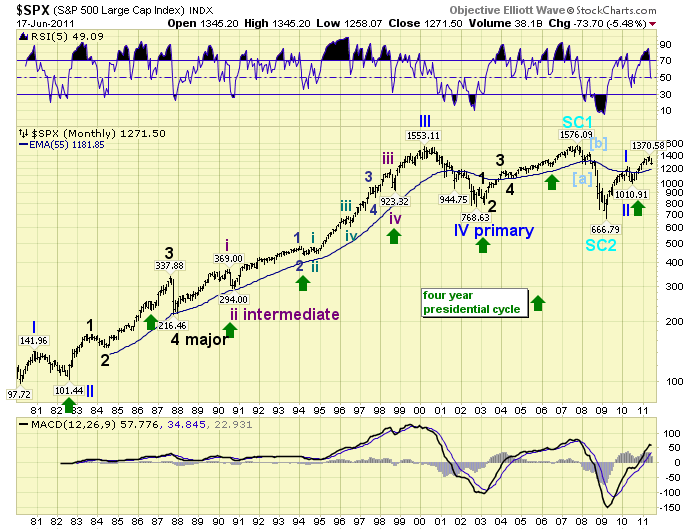
Currently the weekly RSI is the most oversold it has been in the entire bull market. This suggests stocks are relatively cheap for this bull market. The daily RSI recently reached the most oversold condition it has had since the July and September 2010 bottoms. The daily MACD is quite oversold and in between those two lows. The monthly RSI is currently reaching levels not seen since last years April-July correction. And, the monthly MACD shows little signs of weakening as it should during a bull market.
SHORT TERM
Support for the SPX remains at 1261 and then 1240, with resistance at 1291 and then 1303. Short term momentum ended the week at neutral after hitting overbought during friday’s gap up. The wave pattern we have been tracking is a zigzag from the uptrend high at SPX 1371. The first five waves down appears to have taken the form of a diagonal triangle from SPX 1371 to 1312. This is the reason it was quite difficult to determine this choppy pattern. This decline we labeled Minor wave A. The Minor wave B rally was quite sharp and quick as the SPX rallied to 1345 in a matter of days. Minor wave C has been a steady decline as most C waves are. We are counting this decline as four completed Minutes waves: 1306, 1317, 1266, and 1293. Minute wave five either bottomed at SPX 1258, or is still in the process of unfolding. At around SPX 1250 Minor wave C = 1.618 Minor wave A. This happens to be the same relationship that occurred during the Feb-Mar ABC zigzag downtrend. That downtrend ended at SPX 1249. A SPX 1250-ish level or even a bit below would conclude the irregular complex flat from February-June.
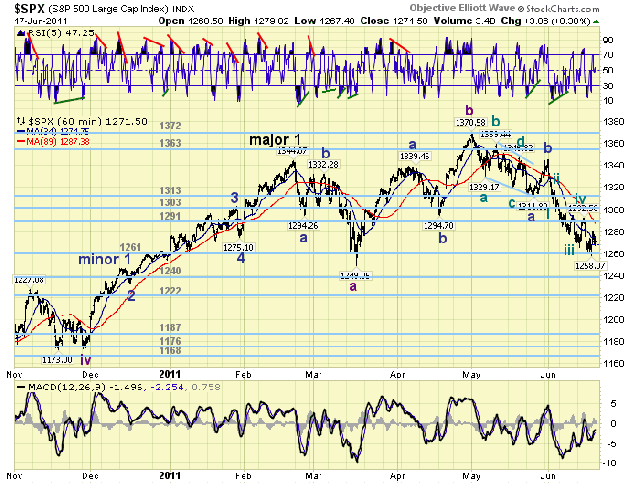
Currently we are observing positive divergences, at recent lows, from the short term charts all the way up to the daily charts. This suggests SPX 1258 may have been the low or we are getting close to it. SPX 1258, btw, is within the 7 point range of the OEW 1261 pivot. Should this pivot fail to hold the next pivot at 1240 should provide strong support. Overhead resistance is now at friday’s SPX 1280 high and then the 1291/1303 pivots. Short term OEW charts remain negative and the market will need to clear 1280 to turn them positive again. Please review friday’s comments for additional details. Best to your trading!
FOREIGN MARKETS
Asian markets were all lower on the week for a net loss of 2.2%. All remain in downtrends.
European markets were mixed, and had a better week for a net gain of 0.6%. Still downtrends across the board here too.
The Commodity equity group were all lower on the week for a net loss of 2.5%. All are downtrending here as well.
The downtrending DJ World index lost 0.9% on the week.
COMMODITIES
Bonds continue to benefit from the correction in the world’s markets. Up 0.2% on the week while the yield dropped to 2.9%.
Crude resumed its downtrend after a short term rally losing 6.4% on the week.
Gold gained 0.4% on the week and remains in what appears to be a corrective uptrend.
The uptrending USD gained 0.3% on the week, as did the Yen. But the EUR lost 0.3%.
NEXT WEEK
Some interesting events ahead of the markets this week. On tuesday we have Existing home sales and the FED starts its two day FOMC meeting. Then on wednesday the FHFA housing price index and the FED FOMC statement. On thursday, weekly Jobless claims and New home sales. Then on friday the final revision to Q1 GDP and Durable goods orders. The market is expecting GDP to be 1.8%. The FED does not have any speeches scheduled at this time. That may change near the end of the week. Best to you and yours as we enter summer in the northern hemisphere.
CHARTS: http://stockcharts.com/...
http://caldaroew.spaces.live.com
After about 40 years of investing in the markets one learns that the markets are constantly changing, not only in price, but in what drives the markets. In the 1960s, the Nifty Fifty were the leaders of the stock market. In the 1970s, stock selection using Technical Analysis was important, as the market stayed with a trading range for the entire decade. In the 1980s, the market finally broke out of it doldrums, as the DOW broke through 1100 in 1982, and launched the greatest bull market on record.
Sharing is an important aspect of a life. Over 100 people have joined our group, from all walks of life, covering twenty three countries across the globe. It's been the most fun I have ever had in the market. Sharing uncommon knowledge, with investors. In hope of aiding them in finding their financial independence.
Copyright © 2011 Tony Caldaro - All Rights Reserved Disclaimer: The above is a matter of opinion provided for general information purposes only and is not intended as investment advice. Information and analysis above are derived from sources and utilising methods believed to be reliable, but we cannot accept responsibility for any losses you may incur as a result of this analysis. Individuals should consult with their personal financial advisors.
© 2005-2022 http://www.MarketOracle.co.uk - The Market Oracle is a FREE Daily Financial Markets Analysis & Forecasting online publication.