


U.S. Dollar’s Close Friday Important for Stocks and Commodities
Stock-Markets / Financial Markets 2011 Jun 17, 2011 - 09:50 AM GMTBy: Chris_Ciovacco

 Investors are faced with numerous concerns, including:
- Weakening economic data: The Federal Reserve Bank of Philadelphia’s general economic index fell to minus 7.7, the lowest since July 2009, from 3.9 the prior month.
- U.S. debt ceiling: On Tuesday Ben Bernanke said, “Failing to raise the debt ceiling in a timely way would be self-defeating if the objective is to chart a course toward a better fiscal situation for our nation.”
- Greece won’t go away: It is obvious, based on the market’s recent reaction, the problems in Greece are serious and they have not been addressed.
- QE2 ending: The Fed’s second quantitative easing program (QE2) is set to formally end this month. As we discussed in this audio interview on Seeking Alpha, the Fed does not yet have the necessary political cover to begin talking about QE3.
Given the concerns above and with many crosscurrents influencing the financial markets, understanding key levels to watch in the currency, stock, and commodities markets can assist us in managing risk.
On June 14, we presented three charts and a table of important levels to watch in the U.S. dollar and the possible impact on stocks and commodities. The table and charts were based on weekly closing figures. Therefore, the important thing is the dollar’s close on June 17, or at the end of the week.
Based on the intraweek close on June 15, the news is not good for stocks and commodities. Below is a “before” and “after” look at one of the charts we showed on June 14.
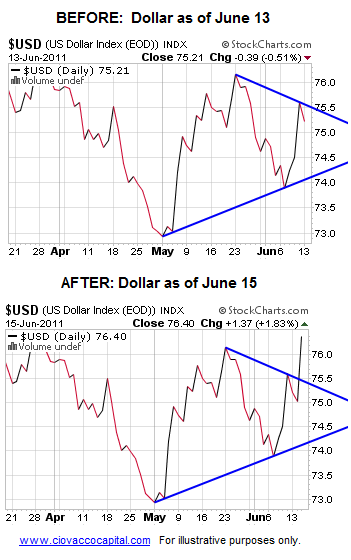
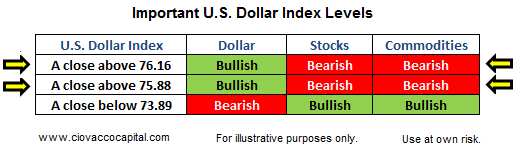
The U.S. Dollar Index closed on June 15 at 76.40, which is above the two key levels shown in the table below. If the dollar holds above 75.88 and 76.16 when we all head out for the weekend on June 17, it is another point of concern for both stocks and commodities.
The weekly chart of the S&P 500 Index below illustrates the importance of weekly closing prices when looking at a weekly chart. The green and blue lines outline what we call the “base trend” for the stock market from the July 2010 lows. Notice at both points A and B the S&P 500 dipped below the green trendline during the week, but stocks rallied and closed back above the trendline by the end of the week. In both cases (A and B) stocks went on to make higher highs, rewarding those who were patient during the week.
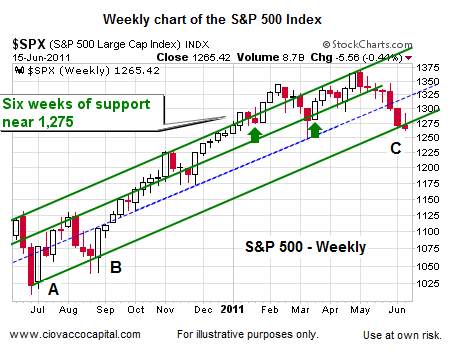
In the chart above, point C shows the current state of affairs in the stock market. During the first week of June, the S&P 500 dipped below the green trendline, but was able to rally back above it by the end of the week. As of the June 15 close, the S&P 500 was again below the green trendline, which is not what the bulls want to see. If the S&P 500 closes on June 16 above 1,270, there is still some hope the bullish trend off the summer 2010 lows will remain intact. A weekly close below 1,270 would put the trendline at risk and would be another bearish check mark for stocks and commodities.
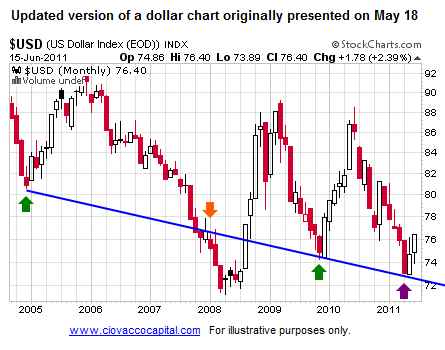
On May 18 we showed the monthly chart below of the dollar and stated:
With an intermediate-term bullish bias seemingly taking root in the dollar, we should be ready to cut back further on commodities and energy-related issues.
The version of the chart below is as of the June 15 close. The dollar did bounce at a logical point relative to the trendline dating back to 2005.
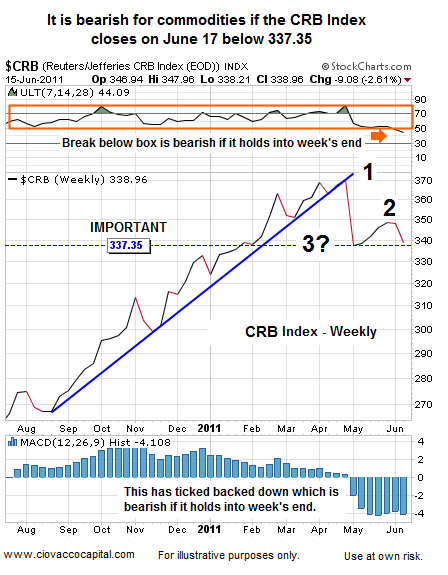
Commodities (DBC), as one would expect when the dollar is strengthening, have been weak and appear on the cusp of completing the third step needed to “confirm” a change in trend. Step 1 (see 1 in chart below) is a break of a trendline. Step 2 is a lower high. Step 3 (see 3?) would be a lower low. A weekly close below 337.35 would “confirm” a bearish trend shift for the CRB Index and commodities in general. A weekly close below 337.25 would have us reduce our commodity exposure even further; although our selling in the last six weeks has reduced our position to a very low percentage allocation already.
We sold our silver (SLV) weeks ago, but we suggest that those who still hold it put a game plan in place to protect profits or cut losses. Silver looks a little better than the CRB Index. A weekly SLV close below 34.18 would add to the concerning evidence in the commodities space. If SLV can hold above 34.18, that would be good for stocks and commodities.
Gold (GLD) looks better than silver, but it also looks vulnerable. A weekly GLD close below 145.30 would add to the deflationary evidence and be a negative for stocks and commodities in general. Since it has Armageddon appeal to investors, gold is much easier to hold in the current environment than commodities (DBC), silver (SLV), or copper.
In the vast majority of our accounts, we sold our remaining stake in copper (JJC) weeks ago. Copper is already in a confirmed downtrend, which is not a good sign for the economy. If JJC can remain above 52.27, it would be good for the big investment picture. If JJC can muster the strength to close above 59.08 in the coming weeks, it may be an early signal that stocks and commodities are starting to firm up a little. A JJC weekly close below 52.27 would be a negative for risk/inflation-protection assets.
We have been and will continue to err on playing defense until we see evidence of an improving economy and/or technical backdrop. This is not a time to blindly stay with the market. We can confidently state that the stock and commodity markets look weaker than they have in quite some time, which is something that needs to be monitored and respected.
By Chris Ciovacco
Ciovacco Capital Management
Copyright (C) 2011 Ciovacco Capital Management, LLC All Rights Reserved.
Chris Ciovacco is the Chief Investment Officer for Ciovacco Capital Management, LLC. More on the web at www.ciovaccocapital.com
Ciovacco Capital Management, LLC is an independent money management firm based in Atlanta, Georgia. As a registered investment advisor, CCM helps individual investors, large & small; achieve improved investment results via independent research and globally diversified investment portfolios. Since we are a fee-based firm, our only objective is to help you protect and grow your assets. Our long-term, theme-oriented, buy-and-hold approach allows for portfolio rebalancing from time to time to adjust to new opportunities or changing market conditions. When looking at money managers in Atlanta, take a hard look at CCM.
All material presented herein is believed to be reliable but we cannot attest to its accuracy. Investment recommendations may change and readers are urged to check with their investment counselors and tax advisors before making any investment decisions. Opinions expressed in these reports may change without prior notice. This memorandum is based on information available to the public. No representation is made that it is accurate or complete. This memorandum is not an offer to buy or sell or a solicitation of an offer to buy or sell the securities mentioned. The investments discussed or recommended in this report may be unsuitable for investors depending on their specific investment objectives and financial position. Past performance is not necessarily a guide to future performance. The price or value of the investments to which this report relates, either directly or indirectly, may fall or rise against the interest of investors. All prices and yields contained in this report are subject to change without notice. This information is based on hypothetical assumptions and is intended for illustrative purposes only. THERE ARE NO WARRANTIES, EXPRESSED OR IMPLIED, AS TO ACCURACY, COMPLETENESS, OR RESULTS OBTAINED FROM ANY INFORMATION CONTAINED IN THIS ARTICLE. PAST PERFORMANCE DOES NOT GUARANTEE FUTURE RESULTS.
Chris Ciovacco Archive |
© 2005-2022 http://www.MarketOracle.co.uk - The Market Oracle is a FREE Daily Financial Markets Analysis & Forecasting online publication.