


Stock Market Indices Buying Opportunity
Stock-Markets / Stock Markets 2011 Jun 15, 2011 - 01:22 PM GMTBy: John_Hampson

 On Monday we saw the intraday sell-off and reversal pattern that I had stated I was looking for, to accompany the mass of bottoming indicators that were flashing. We didn't get everything in alignment (capitulation breadth/volume not as deep as historically, lunar/Puetz downward pressure period not quite complete), but we had more than 10 different oversold technical indicators and contrarian sentiment readings calling for a trend change together with the intraday sell-off and reversal coming just 2 days from the full moon: that was enough for me to add long stock indices positions. It is rare that the market provides perfect alignment and I believe it is probable that was the bottom. If it wasn't the bottom and we hit lower over the next couple of sessions then a reversal would become even more compelling and I would add further on the long side. Let's dive in.
We are approaching the lunar reversal and end of the Puetz crash window, which means positive pressure ahead into early July. I see the possibility of an inverse head and shoulders base into the full moon:
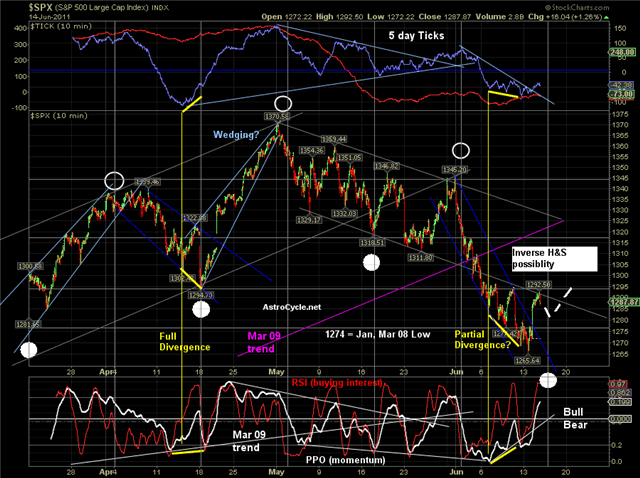
Underlying Source: Astrocycle
The Mclellan tick readings hit on Friday are historically bullish looking forward across this week and next:
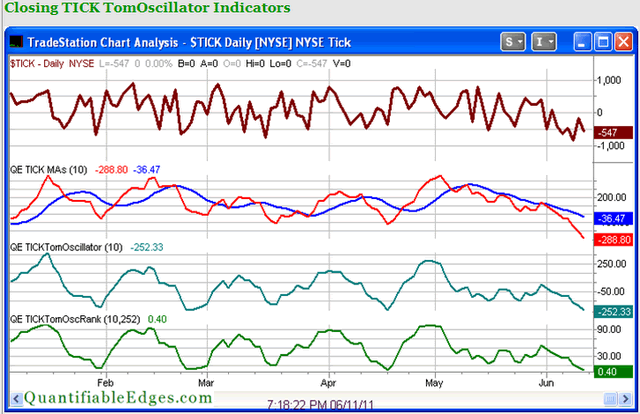

Source: Quantifiable Edges
The last time we saw such a mass of bottoming indicators was mid-March, which turned out to be a significant bottom for the market. The Capitulative Breadth Indicator only hit 8 then, just like this current time, not the historic 10 or above, again suggesting not everything needs to align perfectly.
A better comparision for the current action is mid-2010 when we also faced an economic soft patch and growth slowdown. On the chart below I have highlighted points at which we saw a mass of bottoming indicators flashing in that period. Price action was more volatile than currently because of the flash crash and subsequent nervey participation, but importantly it shows that when the bottoming indicators flashed together, like now, it was a great buying opportunity. Note that the market retested the low or thereabouts on each occasion before advancing - so we may get a second opportunity to add long in the next few sessions. But essentially, buying in when the indicators were flashing was a very profitable move either for a few weeks, or to buy and hold longer term.
So what's likely from here? 1. A move up to a new market high? 2. A move up that stalls like in May/June 2010 and another low later in summer, before the bull advances in earnest to a new high? Or 3. Just an oversold rally in a new cyclical bear market that began at the start of May?
OK, I believe the most likely is 2., followed by 1. A very low likelihood of 3. Here's why.
Firstly, I display the close historical rhyme with the last cyclical stocks bull within this secular stocks bear below. Both by time and by price structure there is a good match. Only the difference in strength and volatility really stands out - the current cyclical bull has been a supercharged and wilder version. By price structure an upleg to a new high should follow here, but by time it should happen as of the Autumn. They correspond to options 1. and 2. above respectively.
Ciovacco's Bull Market Sustainability Index is currently very positive, looking out up to 1 year:
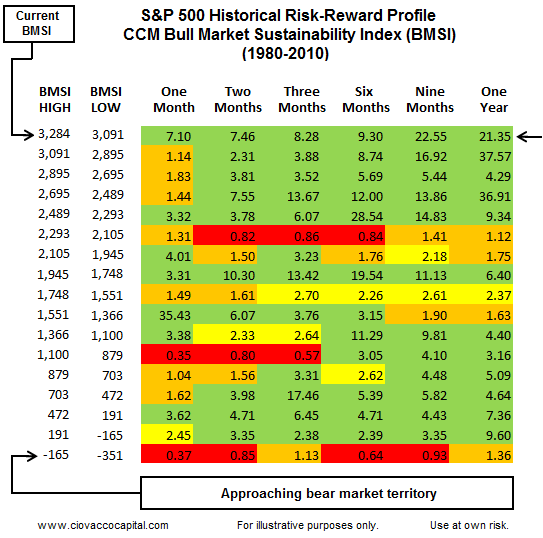
Source: Chris Ciovacco
Likelihood of recession ahead is virtually zero. Furthermore, there have been no recessions in the period from solar minimum rising to solar maximum in over 80 years (from 2009 through to 2013 in this instance). Recessions have occured at or after solar maximums or at minimums.
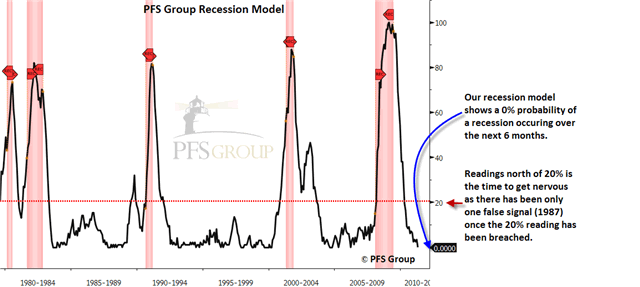
Source: Chris Puplava
Source: Amanita
There was no major divergence in breadth and market internals at the May 2011 high that typically accompany a major top.

Source: Chris Puplava
Chris Puplava's proprietary models still suggest a buy-the-dips strategy.
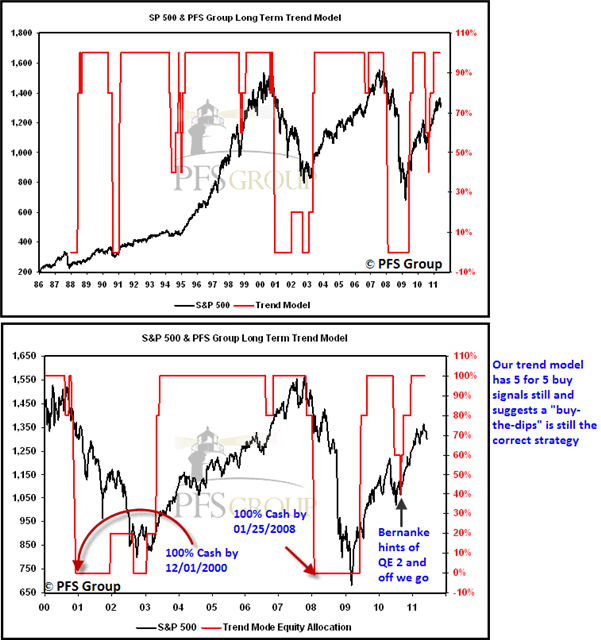
Source: Chris Puplava
ECRI leading indicators have weakened but are still very much positive. Global leading indicators have also generally weakened but remain positive. Japan is quickly recovering and an upturn in growth is expected in H2 2011.
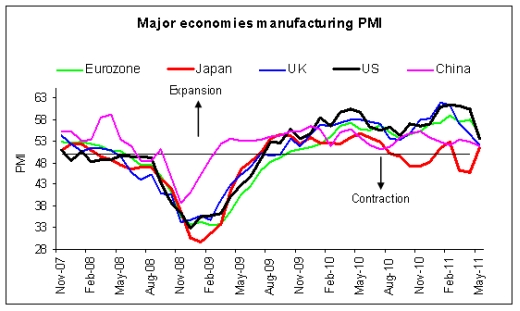
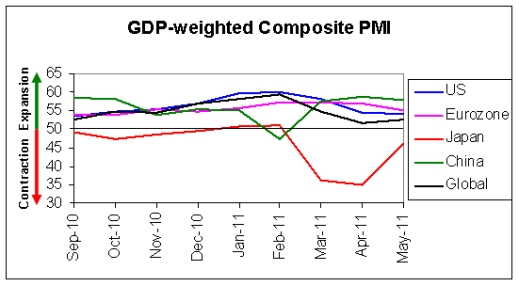
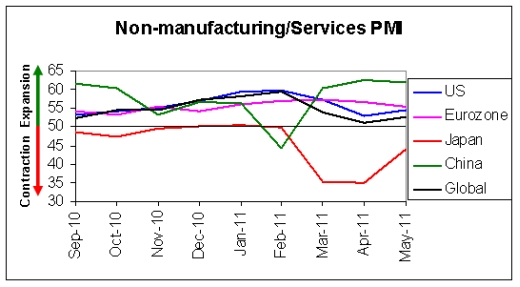
Source: Prieur Du Plessis
Oil prices remain elevated, but have come off some way from their highs. Statistics clearly show that sharp rises in the price of oil have been a key factor in past recessions. Specifically that prise rises of 80-100% have historically been the trigger. From the 2010 lows to recent levels oil has risen close to that kind of percentage, which would imply we are rolling over into recession from here, regardless of other developments.
Well, there are two key differences to historic incidences. One is that the risk of recession differs according to whether there is an actual or feared supply shock for oil. I previously posted a chart showing that speculation is much more responsible for this recent run up than previously (Libya supply reduction isn't major), and crude oil inventories echo that there is no real tightness in supply. The second difference is that countries as a whole have reduced their dependency on oil compared to history, i.e. oil costs as a percentage of GDP. Declining levels of oil intensity suggest that prices would have to reach $160-$200 per barrel to tip us into recession. Oil's rise to $145 in 2008 was certainly a key factor in the recession of that year but the housing market implosion and credit crunch were already underway.
Therefore, if oil prices remain contained in mid-2011 or even decline (possibly either on a conclusion in Libya or a dollar rally), Japan's recovery and general global continued positive feedback looping should see growth pick up in H2 2011 and the stock market advance once the first pointers of that start to emerge. Based on 2010 I would expect we will see further weakening evidence ahead into the summer before indicators of a renewed upturn emerge, but all eyes on the leading indicators.
If Japan's recovery and a weakening oil price either reverse or aren't enough, then what about intervention?
Well, the support of QE is ending this month, and the Fed has made it clear there is no current plan for a QE3. Furthermore, foreign treasury buyers may draw the line at another mass dollar dilution. However, there are other actions that the US Gov and Fed can take. Recall that we are in a Presidential cycle sweetspot for equities - there is a good reason for this. The pre-election year has historically showed good gains due to popular and economically supportive policies with the goal of re-election. No President since Franklin Roosevelt has been elected with the unemployment rate over 7 per cent. Housing also remains depressed. The Gov / Fed will more than likely do something to improve these two big issues, thereby boosting the economy. Banks have large reserves but are reluctant to lend. The Government could incentivise them to lend, or even lend directly into the economy. (Also note that Corporates are also sat on large cash piles. It is possible that they may begin to return cash to shareholders who may redeploy into shares, pushing up the market). And as we know from his key historical speech, Bernanke has a playlist of other actions that could be deployed if things deteriorate or the soft patch extends.
In summary, I believe we have a near term stock market buying opportunity that represents either a profitable multi-week trade or an excellent buy-and-hold entry for a cyclical bull continuation. I believe the weight of evidence is that the current economic soft patch will give way to renewed growth later in 2011 based on Japan/oil price improvement, but also likely with the assistance of some kind of US Gov / Fed intervention.
John Hampson
John Hampson, UK / Self-taught full-time trading at the global macro level / Future Studies
www.amalgamator.co.uk / Forecasting By Amalgamation.
© 2011 Copyright John Hampson - All Rights Reserved
Disclaimer: The above is a matter of opinion provided for general information purposes only and is not intended as investment advice. Information and analysis above are derived from sources and utilising methods believed to be reliable, but we cannot accept responsibility for any losses you may incur as a result of this analysis. Individuals should consult with their personal financial advisors.
© 2005-2022 http://www.MarketOracle.co.uk - The Market Oracle is a FREE Daily Financial Markets Analysis & Forecasting online publication.