


The Stocks and Commodity Market Forecasts
Stock-Markets / Financial Markets 2011 Jun 13, 2011 - 07:19 AM GMTBy: Chris_Vermeulen

 The coming summer should be exciting for traders! While summer trading generally tends to be slow, this one could be different. A large number of other professional traders I talk with are all feeling the tension building in the market. We all think some big movements are just around the corner and the big question is which way are things going to move?
Depending on your trading style you may be viewing the recent market action as the beginning stages of a bear market (major sell off). A bear market is not necessarily impossible as the U.S. Economy is showing the beginning signs of weakness. The fact that stocks have moved lower for almost 6 weeks straight is a recent reminder that we may not be out of the woods just yet. The recent price action and negative sentiment has been harsh enough to make 99% of traders bearish.
In contrast, some traders may be seeing this market as an oversold dip preparing for a bounce/rally in the bull market which we have been in since 2009. Some traders may see this as a buying opportunity because you are a contrarian. Most contrarians generally want to do the opposite of the masses (herd) who are merely trading purely out of emotional sentiment.
I myself have mixed thoughts on the market at this point in time. I’m not a big picture (long trend forecasting) kind of guy but my trading partner David Banister is great at it. Rather I am a shorter term trader catching extreme sentiment shifts in the market with trades lasting 3-60 days in length. So looking forward 2-5 days I feel as though stocks and commodities are going to bottom and start to head higher for a 2-6% bounce. At that point we need to regroup and analyze how the market got there... Was the buying coming from the herd, institutions, or was it just a short covering rally? Additionally, where are the key resistance levels and did we break through any?
During extreme sentiment shifts in the market we tend to see investments fall out of sync with each other for a few days. I feel the attention will be on stocks and we get a bounce this week. I am expecting commodities to trade relatively flat during the same time period.
OK let’s take a quick look at the charts…
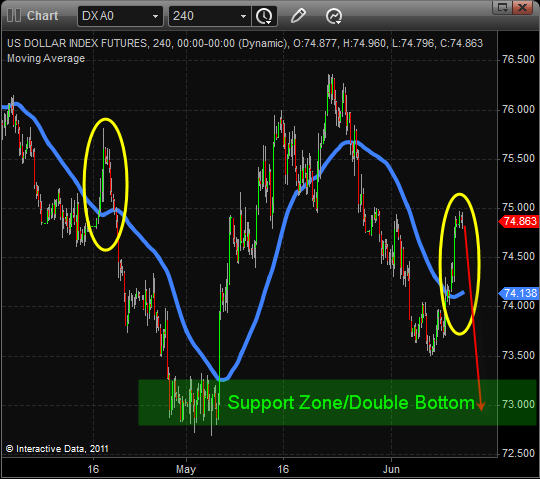
Dollar Index 4 Hour Candles
I feel as though the US Dollar is trying to bottom. It is very possible that we test the May low at which point I would expect another strong bounce and possible multi-month rally. So if the dollar drops to the May lows then we should see higher stocks and commodities, but once the dollar firms up and heads higher it will be game over for risk assets.
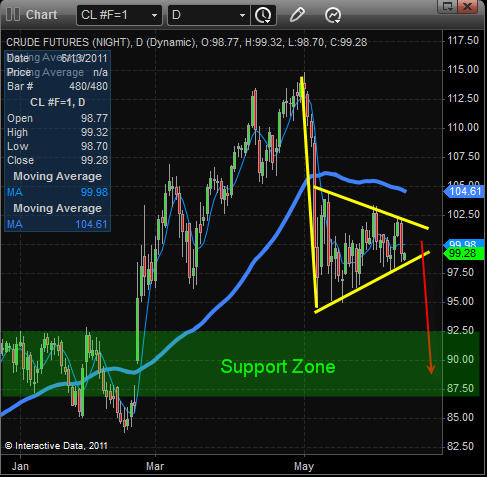
Crude Oil Chart – Daily
Oil took a swan dive in early May and has yet to show any signs of moving higher. Actually crude oil is looking more and more bearish as time goes by.
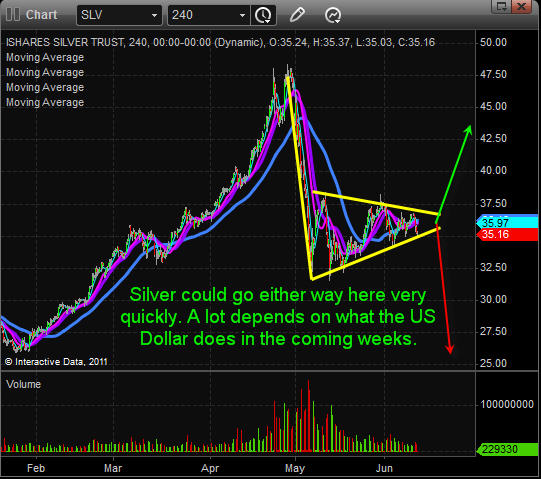
Silver 4 Hour Chart
Silver has formed much of the same pattern that oil has. On a technical basis its pointing to sharply lower prices still. The fact that silver bullion went from an investment to a speculative trading instrument within the past 8 months makes me think it could test the $25 area. The one thing to remember here is that silver is still overall in a bull market. This is a 50/50 guess in my opinion as it nears the apex of this pennant pattern.
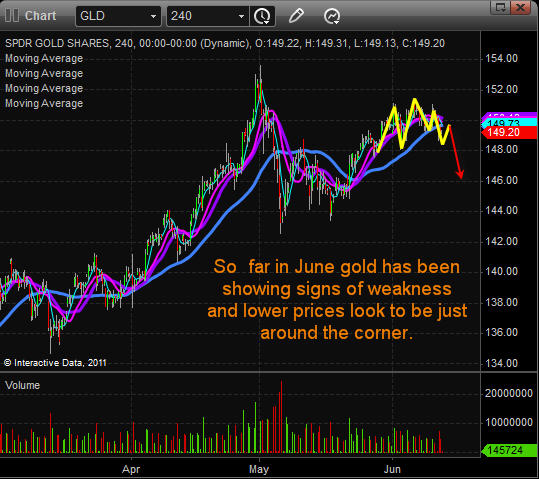
Gold 4 Hour Chart
Gold has held up much better than other metals and commodities and I feel that is because it’s still seen at the REAL safe haven. But reviewing the chart Im starting to see bearish price action beginning to take place.
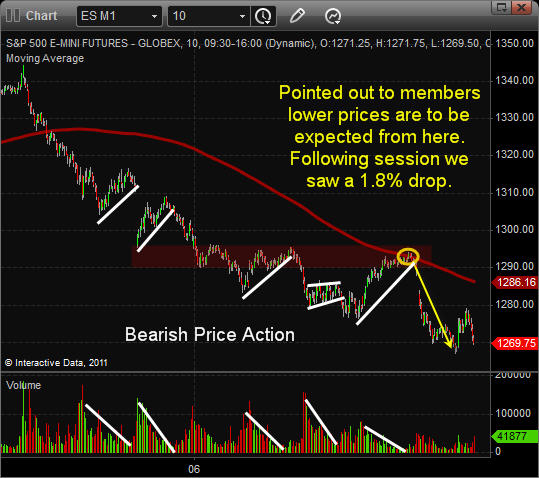
SP500 Futures – 10 Minute Chart Going Back 8 Days
Last week the SP500 continued to show signs of weakness. Any bounce in the market was on light volume and that is because the sellers took a break and let all the small traders buy the market back up. But once the market moved up enough then sellers jumped back in and unloaded their shares.
Last Thursday I sent out an update to members pointing out that lower prices were to be expected. I came to this conclusion because of many data points. Looking at the chart you can see sellers are clearly in control. The SP500 bounces high enough that it reached a key resistance levels going back 5 days. Also the 200 period moving average was at that level. To top that off my sentiment reading for the herd mentality was at a point which sellers like to start dumping their shares again.
Weekly Market Trading Conclusion:
In short, I am getting more bullish for a bounce as the market falls. But once we are into day 3 or 4 of a bounce we must be ready to take profits and/or look for a possible short setup.
If you would like to get more of my daily analysis to join my newsletter at www.GoldAndOilGuy.com
By Chris Vermeulen
Chris@TheGoldAndOilGuy.com
Please visit my website for more information. http://www.TheGoldAndOilGuy.com
Chris Vermeulen is Founder of the popular trading site TheGoldAndOilGuy.com. There he shares his highly successful, low-risk trading method. For 6 years Chris has been a leader in teaching others to skillfully trade in gold, oil, and silver in both bull and bear markets. Subscribers to his service depend on Chris' uniquely consistent investment opportunities that carry exceptionally low risk and high return.
This article is intended solely for information purposes. The opinions are those of the author only. Please conduct further research and consult your financial advisor before making any investment/trading decision. No responsibility can be accepted for losses that may result as a consequence of trading on the basis of this analysis.
© 2005-2022 http://www.MarketOracle.co.uk - The Market Oracle is a FREE Daily Financial Markets Analysis & Forecasting online publication.