


Gold Sideways Trend Suggests Topping Activity
Commodities / Gold and Silver 2011 Jun 12, 2011 - 10:12 AM GMTBy: Merv_Burak

 Although it looks as if gold has been moving sideways for the past two weeks a closer look suggests a topping activity. This coming week should tell us if that is so or not. However, any short term reaction should not be a concern as the longer term picture still looks okay for new highs in the not too distant future.
GOLD
LONG TERM
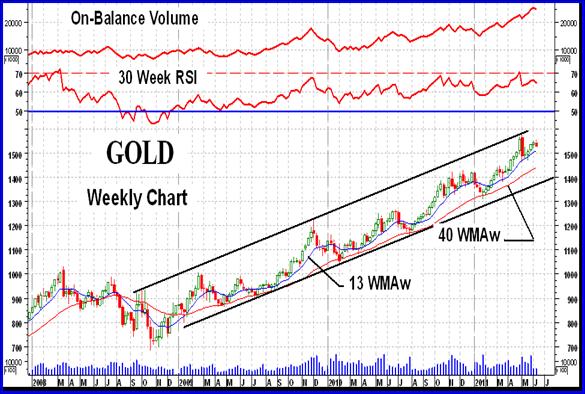
Gold remains within a long term up trending channel. It is, however, near the upper resistance line and one might expect a reaction towards the lower line about now. Having said that, there is not much more negatives from the long term perspective. All is roses at this point.
Gold remains well above its positive sloping long term moving average and the momentum indicator remains well inside its positive zone. Looking at a daily long term chart the momentum indicator is turning lower and has crossed below it trigger line but the trigger is still sloping upwards. The indicator is pushing very slightly into new higher ground but just slightly below it previous high in late 2008. The difference is not enough to justify any negative divergence view. The volume indicator, on a weekly basis, is heading into new all time high territory. On a daily basis it is also at new high levels but one can discern a possible topping activity in this indicator. Still, when all is put together we continue to have a BULLISH rating for the long term.
INTERMEDIATE TERM
In the past few months gold has touched its intermediate term moving average line and bounced right back to the up side. It remains well above the line on the Friday close but a couple of volatile negative days could just see gold dropping below the line. The intermediate term momentum indicator remains in its positive zone but the action over the past few weeks suggest a very labored upside move. The topping is quite evident here. The indicator is now well below its lowest level over the past couple of weeks and heading down aggressively. It has moved below its trigger line and the trigger has turned to the down side. Still, it is some distance from dropping into its negative zone. As for the volume indicator, it remains above its positive sloping trigger line but in a topping trend. For the intermediate term the rating remains BULLISH but with more risk of turning negative than the long term. This rating is confirmed by the short term moving average line remaining above the intermediate term line.
SHORT TERM
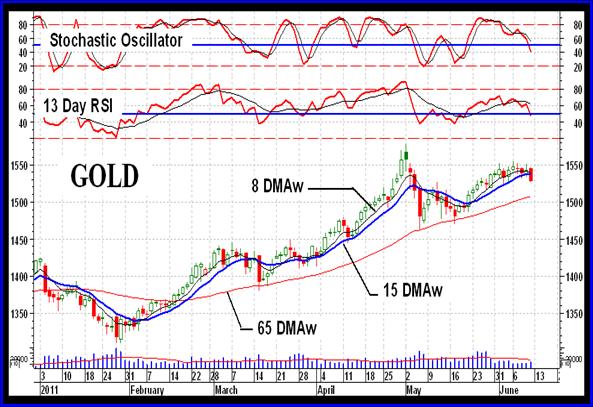
Looking at the short term chart the indicators are literally screaming “topping”. Both the short term momentum and the more aggressive Stochastic Oscillator (SO) are now in their negative zones and seem to be heading even lower. The question now is not if gold is in a topping mode but how long it will stay there and how low will it go. Although I often do try to guess how far a trend will go I am more of a follower determining where we are now and what is the present direction of the trend. In the end I fall back on the tried and true technical concept that “a trend in motion remains in motion until a reversal has been verified”.
So, where are we now as far as the short term perspective is concerned? Gold has just closed below its short term moving average line and the line has turned to the down side. Gold is now at its lowest price in two weeks. As mentioned, the short term momentum indicator has now moved into its negative zone and is below its negative sloping trigger line. It did give us a short term negative divergence warning and has been making lower lows and lower highs for the past two weeks. As for the daily volume action, that has been pretty light over the past couple of weeks and remains below its 15 day average volume line.
Volume action is a tricky thing to try and assess. Too often it is not acting as the text books say it should act. I have found the volume action too often contrary to what one would expect. As an example, low volume action of down price moves is NOT necessarily bullish or bearish. It is just what one would expect from the actions of the masses who halt their activities during down days. Increased volume on up days is also not necessarily bullish. The masses just normally increase their activities when they see prices moving higher. They are afraid of missing out on the move. If one can determine what the NORMAL volume is on these up and down days then one can decide if the actual volume is increasing above the norm and is bullish or bearish. This norm is almost impossible to determine as it changes with time so to try and assess what the low volume action is telling us is next to impossible. How is that for a cop-out in not assessing the import of volume action?
Anyway, getting back to the indicators, they all are telling us that the short term rating is now BEARISH. However, the very short term moving average line has not quite crossed below the short term line so confirmation of this bear must wait another day.
SILVER
I have just returned from two weeks on the move (some call it a vacation but it just seems like you work harder during a vacation trying to relax than you do during normal days). Today, I am a little behind time so I will cut the rest of the commentary short and return with a full commentary next week.
Silver has been under performing relative to gold ever since the plunge. Although the long term rating is still BULLISH both the intermediate and short term ratings are BEARISH. Just a personal view but it does look like silver will continue to under perform gold for some time still. It has over performed for some time so this may just be a getting even trend.
PRECIOUS METAL STOCKS
Gold declined 0.9% during the week but the stocks tumbled by 5% or more. Silver was up on the week but both silver Indices were lower, the Spec-Silver was down 7.5%. This disconnect between the performance of the commodity versus the performance of the stocks is not unusual. In fact I would say that one should consider such deviation as normal, on the up side as well as the down side.
One point to keep in mind, it is not unusual for the stocks to be LEADING indicators as to where the commodity is heading in the future, so traders in gold and silver should be very cautious when trading on the up side. One would be taking an extra amount of risk if one were trading in stocks on the up side at this time. It’s just not that bullish of an environment. Better to wait for things to turn around before jumping into the market, unless one is a short sell trader.
Merv’s Precious Metals Indices Table
Well, that’s it for this week. Comments are always welcome and should be addressed to mervburak@gmail.com.
By Merv Burak, CMT
Hudson Aero/Systems Inc.
Technical Information Group
for Merv's Precious Metals Central
For DAILY Uranium stock commentary and WEEKLY Uranium market update check out my new Technically Uranium with Merv blog at http://techuranium.blogspot.com .
During the day Merv practices his engineering profession as a Consulting Aerospace Engineer. Once the sun goes down and night descends upon the earth Merv dons his other hat as a Chartered Market Technician ( CMT ) and tries to decipher what's going on in the securities markets. As an underground surveyor in the gold mines of Canada 's Northwest Territories in his youth, Merv has a soft spot for the gold industry and has developed several Gold Indices reflecting different aspects of the industry. As a basically lazy individual Merv's driving focus is to KEEP IT SIMPLE .
To find out more about Merv's various Gold Indices and component stocks, please visit http://preciousmetalscentral.com . There you will find samples of the Indices and their component stocks plus other publications of interest to gold investors.
Before you invest, Always check your market timing with a Qualified Professional Market Technician
Merv Burak Archive |
© 2005-2022 http://www.MarketOracle.co.uk - The Market Oracle is a FREE Daily Financial Markets Analysis & Forecasting online publication.