


U.S. Economy Brakes Even Before Fed Takes Its Foot Off the Accelerator
Economics / US Economy Jun 09, 2011 - 02:19 PM GMTBy: Paul_L_Kasriel

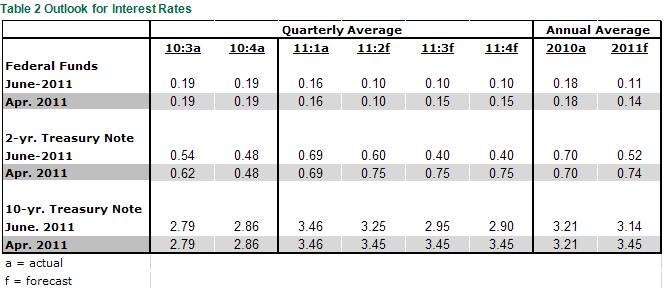
 In our April 28 update, we emphasized that our forecast was in “transition” from stronger to weaker in large part depending on the behavior of bank credit. This month we have made the transition to a significantly weaker outlook, not only because of the current behavior of bank credit, but also because of the current behavior of the overall economy. With regard to the latter, even before the Federal Reserve has terminated its second round of quantitative easing – that is, even before the Fed has taken its foot off the monetary accelerator – the underlying pace of U.S. economic activity already appears to be coming in weaker than we had anticipated. Consistent with our downwardly-revised real GDP growth outlook, we have revised up our forecast for the unemployment rate. In addition, we have revised down our forecast for the yield levels of the Treasury 2- and 10-year securities. (See tables at the end of this commentary containing our current and April 28 forecasts.) If we are close to the mark on our second-half GDP and unemployment rate forecasts, we could envision another round of Fed quantitative easing commencing early in 2012 with no Fed policy interest rate hikes occurring until early 2013.
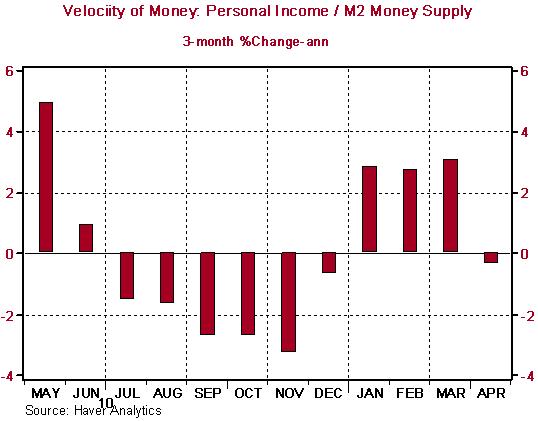
Although quantitative easing might not help stimulate domestic spending on goods, services and assets, in the words of our grandmothers – it couldn’t hurt. All else the same, if the Fed purchases securities in the open market, the seller of these securities can do one or a combination of three things with the freshly-printed sales proceeds – spend them, lend them or just hold them. If sales proceeds are spent or lent, then there is a net increase in spending on something in the economy. Only if the sales proceeds are just held, representing a decrease in the velocity of money in economists’ lingo, would quantitative easing not lead to a net increase in spending in the economy. As it turns out, it appears as though one concept of velocity of money has decreased of late (see Chart 1).
Chart 1
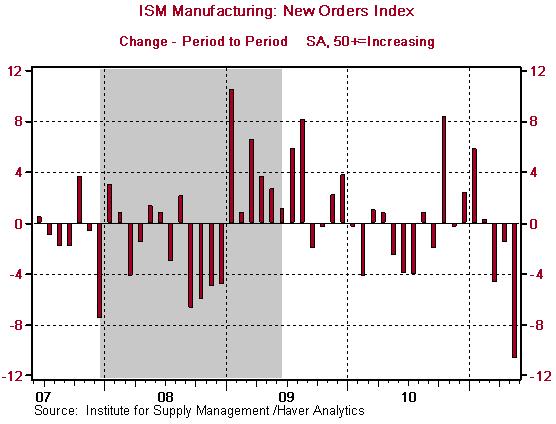
Evidence is abundant that the pace of economic activity has slowed recently. One of the most reliable indicators of current economic activity is the New Orders Index of the ISM-Manufacturing report. Chart 2 shows that this index has fallen for three consecutive months. The May decline of 10.7 points was the largest monthly point decrease since October 2001.
Chart 2
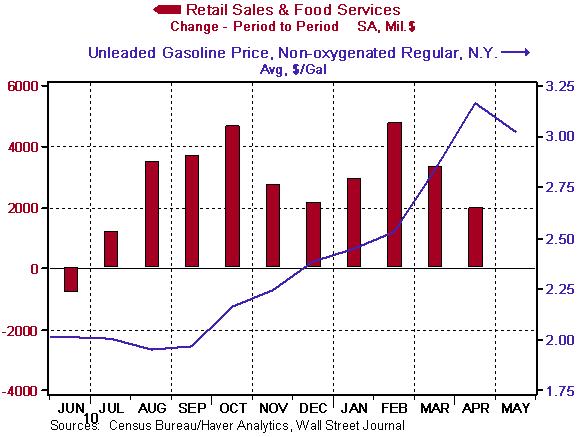
Another indication of a current weakening in the pace of economic activity is the slowing in the growth of nominal retail sales (see Chart 3). With increasing gasoline prices, a slowdown in the growth of price-adjusted retail sales would be expected as households devoted a larger share of their nominal disposable income to the purchase of the same or slightly smaller number of gallons of gasoline, leaving less income left over for the purchase of other goods and services whose prices did not rise as much. Hence, growth in the price-adjusted amount of goods and services would fall. But why would growth in the nominal value of goods and services fall unless there was something other than the rising price of gasoline adversely affecting consumer purchases?
Chart 3
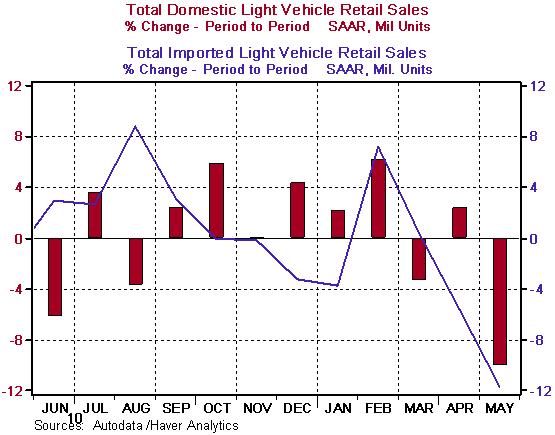
Another indication of a fundamental weakening in household spending was the slowdown in May light motor vehicle sales (see Chart 4). Although some of the weakness in these sales might be attributed to supply interruptions from the recent natural disasters in Japan, the fact that the percentage decline in sales of both domestically-produced vehicles (-10.1%) and imported vehicles (-11.7%) was approximately the same suggests that there was some factor in addition to supply interruptions adversely affecting May sales (see Chart 5).
Chart 4
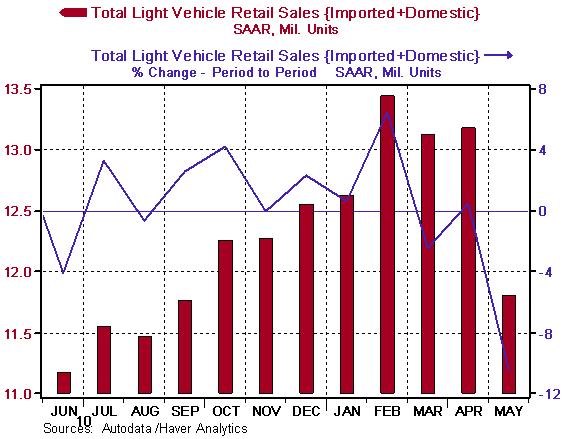
Chart 5
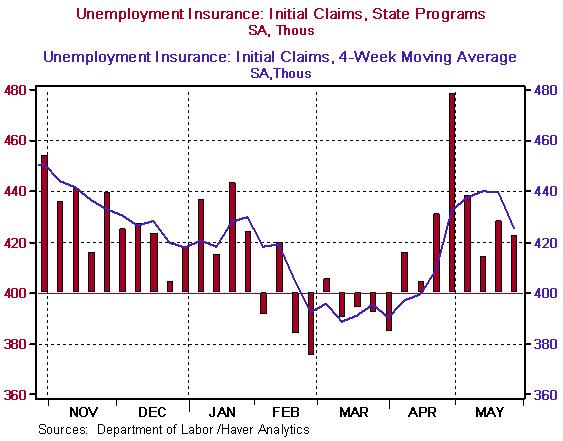
The recent behavior of initial unemployment insurance claims suggests some weakening in the demand for labor (see Chart 6). Seasonally-adjusted initial claims had dropped below 400,000 in February and March. Some one-off special factors caused initial claims to spike in April. But the level of initial claims in May had yet to return to the sub-400,000 level that had prevailed prior to the April spike.
Chart 6
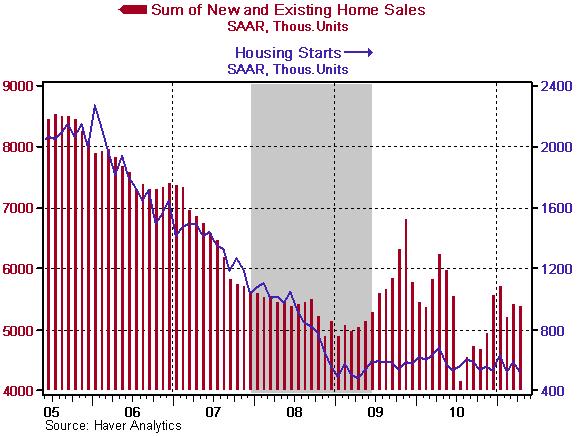
Not that this is a new development, but the housing market continues to bounce along the recession bottom. Both sales and starts remain weak (see Chart 7).
Chart 7
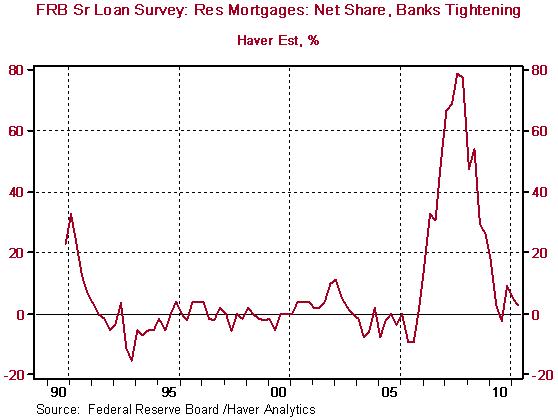
There are at least two factors holding back a significant housing market recovery – tight mortgage underwriting standards and a relative excess supply of housing. The purchase of a house is a very attractive asset purchase now – or at least it was in the first quarter of this year – as illustrated in Chart 8. Plotted in this chart is the “yield” on owner-occupied housing and the financing rate of owner-occupied housing. The “revenue” stream from owner-occupied housing is the imputed rent on this housing. Dividing this aggregated imputed rent by the market value of the stock of existing owner-occupied housing yields a yield on owner-occupied housing. The wider the positive differential between the yield on owner-occupied housing and the rate at which the purchase of owner-occupied housing can be financed, the more attractive the purchase of a house – all else the same. In the first quarter of this year this positive differential was 260 basis points – down 11 basis points from Q4:2010 differential, which was the widest in the history of this series. So, if the purchase of a house is so attractive now, why are not more houses being purchased? It might have something to do with the inability of being able to qualify for a mortgage. Although the percentage of banks tightening their mortgage lending standards may have fallen in recent quarters (see Chart 9), this does not mean that banks are easing their lending standards. A large percentage of banks tightened their mortgage lending standards in 2007 and those standards might not now be tighter, but that does not mean they are easier.
Chart 8
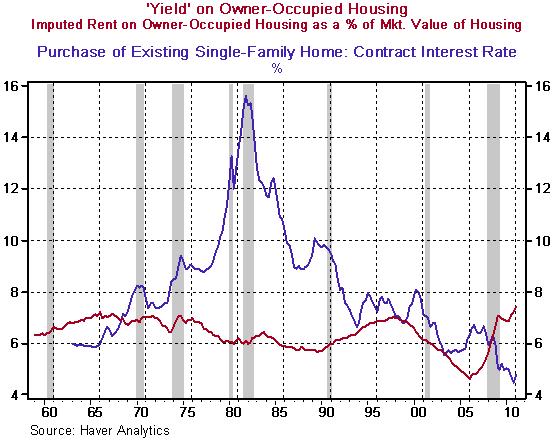
Chart 9
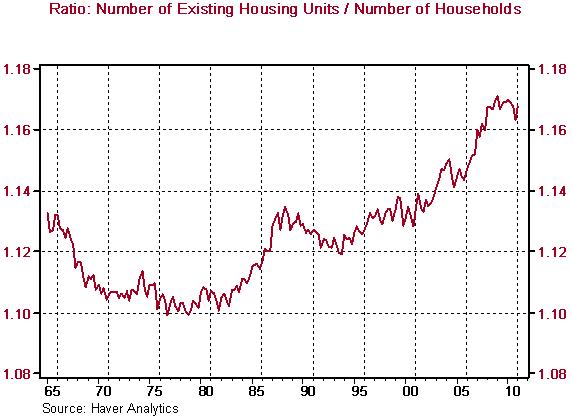
Why build a lot of new houses when there already is an excess supply of existing ones? Chart 10 shows that the ratio of the number of existing housing units – detached single-family, condo units and rental apartment units – to the number of households to go into those housing units is just off a record high.
Chart 10
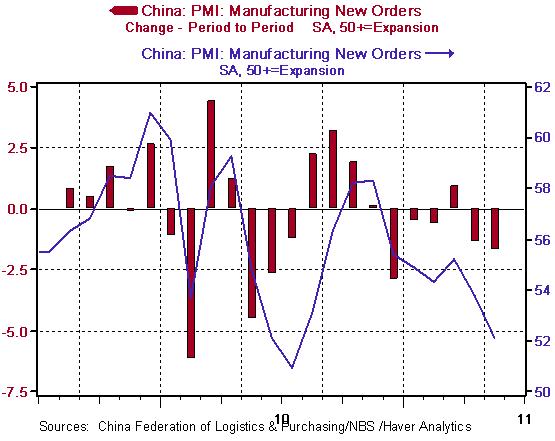
Okay. We have enumerated some elements of current weakening in the pace of U.S. economic activity. Let’s broaden our view and look beyond our borders to one of the largest economies in the world – China. Chart 11 shows that the New Orders Index of the Chinese manufacturing Purchasing Managers report is trending lower, having declined in five of the past six months. Although China is a major exporter of finished goods, it also is major importer of raw materials and semi-finished goods. As the Chinese economic growth slows, so, too, will Chinese import growth, which, directly and indirectly, will adversely affect U.S. export growth.
Chart 11
The resolution of the Greek debt tragedy, whatever it turns out to be, is likely to have some negative effect on current European bank capital or future retained earnings. This will inhibit credit creation in the eurozone, which again, will directly or indirectly adversely affect growth in U.S. exports.
So, these are the headwinds while the Fed still is engaged in quantitative easing. What will happen to the sum of Federal Reserve and commercial bank created credit – i.e., credit created figuratively out of thin air – when the Fed terminates its quantitative easing program at the end of June? Chart 12 shows that the Federal Reserve is responsible for all of the combined Fed and commercial bank credit created since the inception of the Fed’s second round of quantitative easing that commenced at the beginning of November 2010. Unless commercial banks miraculously crank up credit creation starting in July, combined Fed and bank credit will dry up, which, all else the same, will adversely affect already-weak growth in the aggregate demand for goods and services. Both the consensus of private economists’ forecasts and Fed officials’ forecasts (is there any difference between the two?) are calling for an increase in real GDP growth in the second half of this year. We respectfully dissent. We expect marginally slower growth and see the risks rising for significantly slower growth.
Chart 12

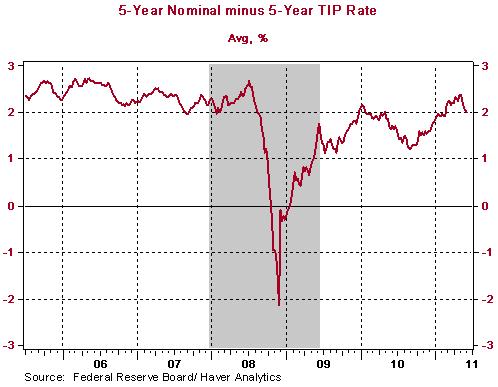
The slowing in Chinese economic growth is likely to result in a decrease in the rate of change in the U.S. CPI. The largest part of the acceleration in the growth of the U.S. CPI has come from commodity price increases. Chart 13 shows that there is a relatively high correlation between the pace of Chinese economic activity this month and the level of commodity prices four months in the future. So, with Chinese economic growth slowing, we can expect some moderation in commodity price increases going forward. And of course, appealing to Milton Friedman’s dictum that inflation is always and everywhere a monetary phenomenon, the termination of quantitative easing on the part of the Fed will remove the “oxygen” necessary to sustain the recent inflationary flare-up. The Treasury securities market seems to share our sanguine outlook on the prospects for the CPI, currently expecting the CPI to increase on average only about 2% per year over the next five years (see Chart 14).
Chart 13
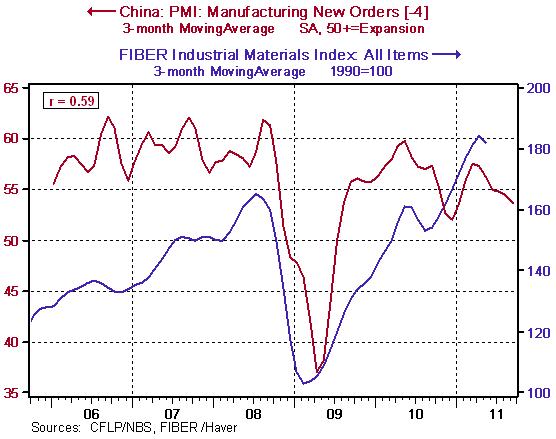
Chart 14
With the downward revision to our real GDP growth forecast and our forecast of a slower rate of growth in the CPI, we see little chance of a Fed decision to raise any of its policy interest rates over the remainder of this year or early next year. In fact, we could easily imagine the Fed not touching its interest rate dials until sometime in 2013. That is, not touching the dials to increase interest rates. We could envision the Fed making a decision sometime this year to lower the interest rate it pays on bank reserves in an effort to encourage banks to increase lending to entities other than the Fed itself. If our GDP, unemployment rate and CPI forecasts are close to the mark, we also could envision the Fed revisiting quantitative easing early in 2012 when the anti-QE Fed Bank presidents realize that their economic forecasts were incorrect, as usual. The yield on the Treasury 10-year security already has made the adjustment to weaker economic growth and a moderation in the rate of increase in the CPI. Unless the prospects for an outright new recession in the next six months should become more prominent, we believe that the 10-year yield will oscillate around the 3% level over the second half of the year. We see a greater risk of the 10-year yield moving down to its early-October 2010 level of about 2.40% than moving back up to its early-February 2011 level of about 3.75%.

Paul Kasriel is the recipient of the 2006 Lawrence R. Klein Award for Blue Chip Forecasting Accuracy
by Paul Kasriel and Asha Bangalore
The Northern Trust Company
Economic Research Department - Daily Global Commentary
Copyright © 2011 Paul Kasriel
Paul joined the economic research unit of The Northern Trust Company in 1986 as Vice President and Economist, being named Senior Vice President and Director of Economic Research in 2000. His economic and interest rate forecasts are used both internally and by clients. The accuracy of the Economic Research Department's forecasts has consistently been highly-ranked in the Blue Chip survey of about 50 forecasters over the years. To that point, Paul received the prestigious 2006 Lawrence R. Klein Award for having the most accurate economic forecast among the Blue Chip survey participants for the years 2002 through 2005.
The opinions expressed herein are those of the author and do not necessarily represent the views of The Northern Trust Company. The Northern Trust Company does not warrant the accuracy or completeness of information contained herein, such information is subject to change and is not intended to influence your investment decisions.
Paul L. Kasriel Archive |
© 2005-2022 http://www.MarketOracle.co.uk - The Market Oracle is a FREE Daily Financial Markets Analysis & Forecasting online publication.