


China SSEC Stock Market Index Could Double
Stock-Markets / Chinese Stock Market Jun 07, 2011 - 07:55 AM GMTBy: Tony_Caldaro

China SSEC Stock Market Index Could Double
 Back in December, 2010 we posted a special report on China’s SSEC. OEW suggested this market had some additional sideways/down work to do before it completed Primary wave IV. As you are likely aware, while the rest of the world has been in a bull market China’s equity market has been in a bear. This is not that unusual for this index as it often moves to its own beat.
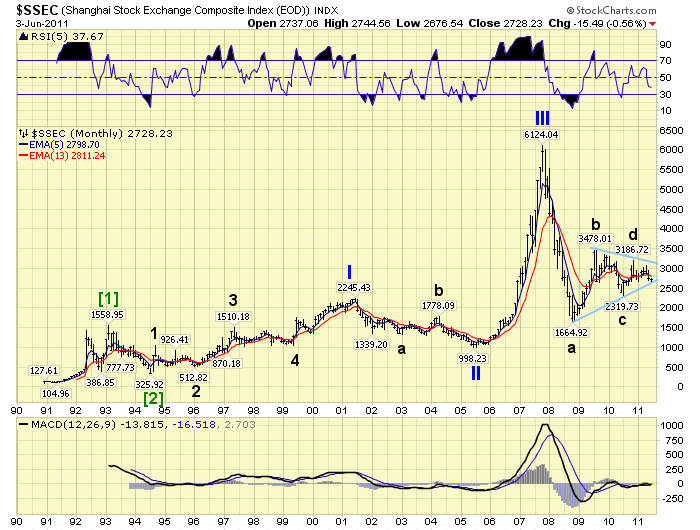
After the report we observed a rally to the upper trendline on a contracting wedge shaped triangular Primary IV. This completed Major wave D of the five Major wave triangle. Since that high we have observed an ABC decline into what appears to be a completing Major wave E and the Primary wave IV. Should this count work out to be correct China’s SSEC could double in the next two years in a Primary wave V bull market.
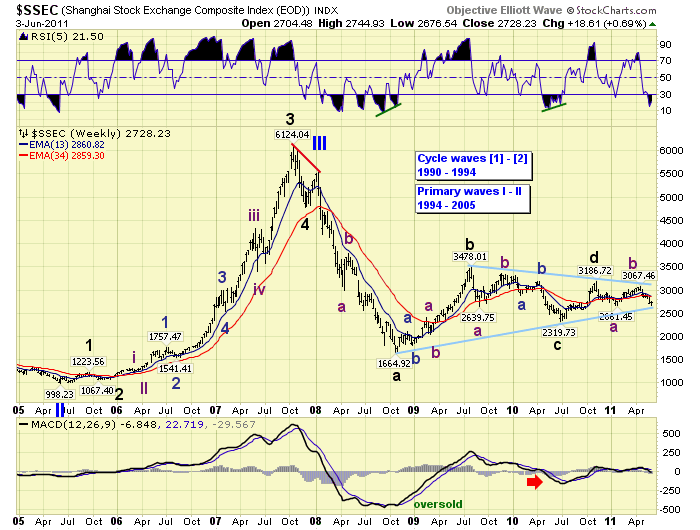
Supporting this view are some normal and abstract technical factors. First, of course, is the two plus year distinct triangular formation from the Oct 2008 low. Notice, on the weekly chart, the A-C-E waves all hit extreme oversold RSI conditions. Also notice that the MACD has been riding above neutral since the Major wave D rally. This has bullish implications.
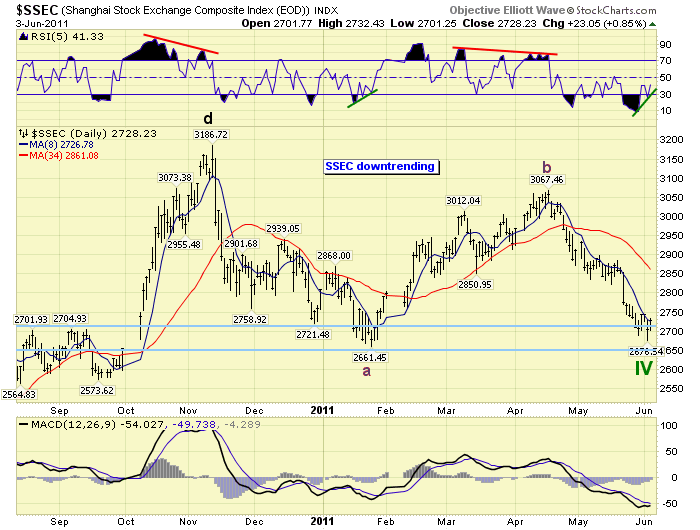
The daily chart displays part of the Major D wave rally and the rest of the market action since then. Notice the peaks have concluded on negative RSI divergences, and the bottoms on positive divergences. There is a tentative positive divergence at work after the recent low on thursday and right in our support band: SSEC 2660-2720.
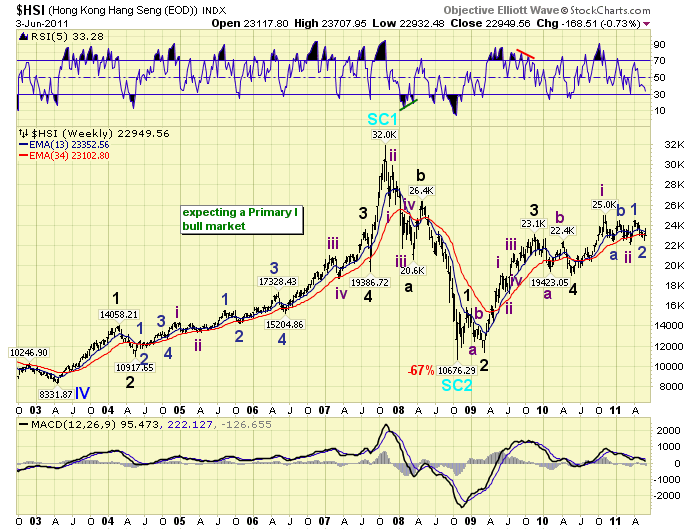
Hong Kong’s HSI has been in a bull market since Oct 2008. Notice how the HSI had a strong rally then a gradual drift up between 2003 and 2005. Then when China’s SSEC entered a bull market they both soared together into a 2007 top. This same type of event appears to be setting up again.
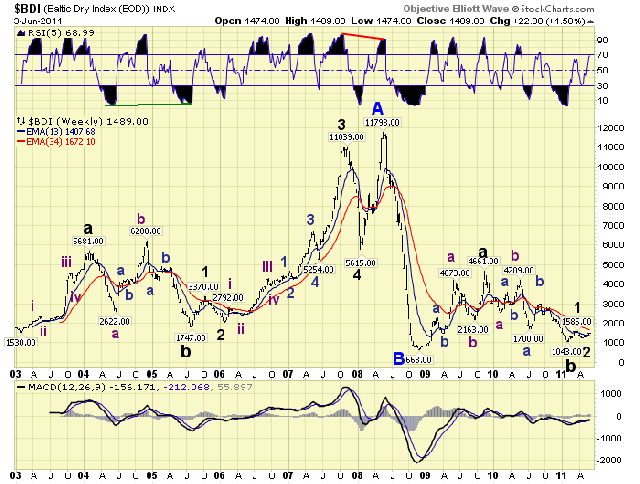
The BDI represents the Baltic Dry Index. This is an index which tracks the daily rental prices of large sea going vessels. Notice again the relationship between 2003-2005 and 2008-2011: similar choppy and widely swinging patterns. When demand picked up in China for raw materials in 2006 rental rates soared into early 2008. A similar pattern, and wave count, appear to be unfolding now. Currently, the SSEC would have to drop below 2320 to void this potential scenario. Should this scenario work out, as expected, the SSEC should soar to over 6100 in a Primary wave V by 2013. The risk/reward looks quite appealing. One last note. The last time we turned bullish and wrote a report to that effect was in early 2006: http://objectiveelliottwave.com/Chinabullmarket.aspx.
CHARTS: http://stockcharts.com/...
http://caldaroew.spaces.live.com
After about 40 years of investing in the markets one learns that the markets are constantly changing, not only in price, but in what drives the markets. In the 1960s, the Nifty Fifty were the leaders of the stock market. In the 1970s, stock selection using Technical Analysis was important, as the market stayed with a trading range for the entire decade. In the 1980s, the market finally broke out of it doldrums, as the DOW broke through 1100 in 1982, and launched the greatest bull market on record.
Sharing is an important aspect of a life. Over 100 people have joined our group, from all walks of life, covering twenty three countries across the globe. It's been the most fun I have ever had in the market. Sharing uncommon knowledge, with investors. In hope of aiding them in finding their financial independence.
Copyright © 2011 Tony Caldaro - All Rights Reserved Disclaimer: The above is a matter of opinion provided for general information purposes only and is not intended as investment advice. Information and analysis above are derived from sources and utilising methods believed to be reliable, but we cannot accept responsibility for any losses you may incur as a result of this analysis. Individuals should consult with their personal financial advisors.
© 2005-2022 http://www.MarketOracle.co.uk - The Market Oracle is a FREE Daily Financial Markets Analysis & Forecasting online publication.
Comments
|
Jonak
08 Jun 11, 05:03 |
4th wave
in the very first chart , price of the 4th wave have entered the price territory of 1 ...is that legal?? |