


Stock Market Close to a Bottom
Stock-Markets / Stock Markets 2011 Jun 05, 2011 - 06:14 AM GMTBy: Tony_Caldaro

 A holiday shortened week was no help to the market this week as the SPX/DOW declined 2.3%. This was the biggest weekly decline since the 2.2% decline in November. On the economic front decliners beat advancers two to one. The negatives included declines in Case-Shiller (a new low), the Chicago PMI, Consumer confidence, ISM manufacturing, ADP, monthly Auto sales, Factory orders, the WLEI, and the Payrolls report. The Unemployment rate rose.
On the plus side, Construction spending, weekly Jobless claims, Q1 Productivity, ISM services and the Monetary base all improved. As for the markets it wasn’t much better. The NDX/NAZ lost 2.1%, while the DJ World dropped 1.0%. Asian markets lost 0.3%, European markets were -0.9%, and the Commodity equity group was -0.8%. Bonds benefitted from the decline in equities +0.7%, Crude lost 0.2%, Gold gained 0.4%, and the USD was not a safe haven this week -1.0%.
LONG TERM: bull market
As we reviewed the charts this weekend we could not find one of the fifteen world indices we track in an uptrend. Nor could we find one of the nine SPX sectors in an uptrend either. All of these indices are in confirmed downtrends. But this is medium term: weeks to months. Longer term, we see most of these indices in bull market uptrends.
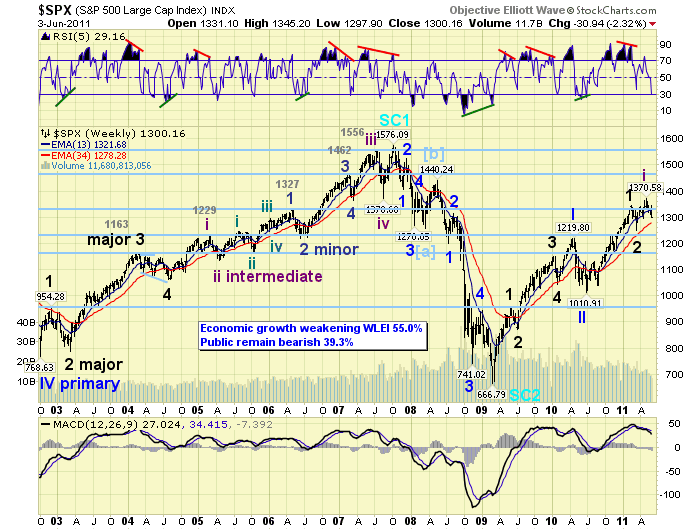
The weekly chart displays, after five consecutive weeks of declines – which has not occurred since 2004, the SPX is still in a long term bull market. Since Mar09 the RSI has remained mostly overbought, and has rarely been oversold as it is now. The MACD remains above neutral, as it has been the entire bull market.
Our OEW count remains bullish. The March 2009 bull market is expected to top in 2012. Since we are counting it as a Cycle wave [1], it should consist of five Primary waves. Primary waves I and II completed in Apr10 and July10 respectively. Primary wave III has been underway since that low. Currently, a drop below SPX 1011 would invalidate this count. Since Primary wave I divided into five Major waves we expected Primary III would do the same. Major waves 1 and 2 concluded in Feb11 and Mar 11 respectively. Major wave III has been underway since that low.
Recently, after a medium term uptrend to SPX 1371, the market confirmed a downtrend. Which is still underway. This suggests Major wave 3 is also dividing. Subdivisions of Major waves are five Intermediate waves. Therefore, we labeled the SPX 1371 high as Intermediate wave one, and Intermediate wave two is underway now. This subdivision does not change our long term outlook. Third waves of third waves, (i.e. Major 3 of Primary III) often subdivide. Once this correction ends Intermediate three of Major 3 of Primary III should unfold.
MEDIUM TERM: downtrend low SPX 1298
The daily chart displays most of Major wave 1; then Major wave 2, Intermediate wave one and the current Intermediate wave two. Notice the recent uptrend, Intermediate wave one, hit a print high in May and was nearly two months long. The current downtrend is currently about one month long. Intermediate waves one and two of Major wave 1 took about one month and less than a month respectively. Therefore we should expect Intermedate wave two to end in June. Corrections typically take less time to unfold than the time of the rising wave they correct.
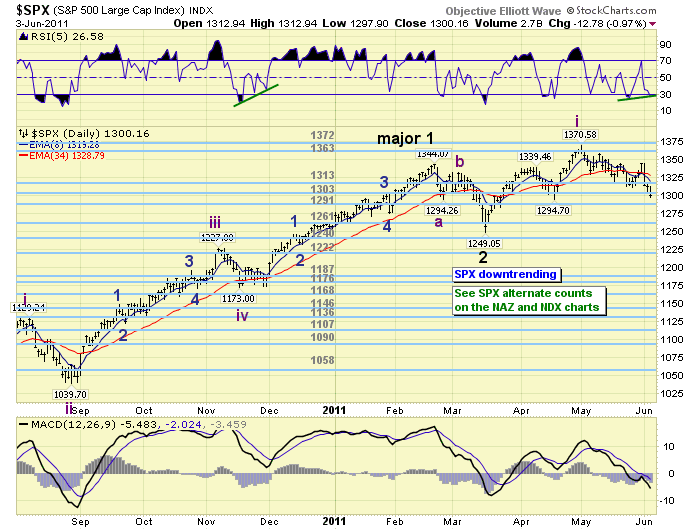
When we examine this correction in terms of the technicals we apply we observe some interesting positives at this stage. First, a fibonacci 61.8% correction of the Mar-May uptrend is at the SPX 1296 level, i.e. 1371 – (0.618 x 122 = 75). SPX 1295 is Minor wave 4 of the prvious uptrend, and SPX 1294 was Intermediate A of the previous correction. The hourly/daily charts are currently displaying positive divergences. These often occur at significant lows. The weekly RSI is displaying an oversold condition. We have only had two others during this entire bull market: the Major wave 4 low in Feb10, and the Primary wave II low in July10. In the last bull market these types of oversold conditions also marked the end of downtrends. The wave count suggests this decline is the endng C wave of a complex double three. And, the OEW 1291 pivot contains all of the above price levels within its 7 point range.
SHORT TERM
Support for the SPX is at 1291 and then 1261, with resistance at 1303 and then 1313. Short term momentum ended friday with a positive divergence. We’ve been counting this correction as an Aabc-Bx-Cabc double three. The first zigzag completed at SPX 1319: a 52 point decline (1371-1319). After an Bx wave rally to SPX 1347, then second zigzag got underway. Thus far it has declined 49 points: (1347-1298). At SPX 1295 it will equal the first zigzag. Another price/wave relationships within the OEW 1291 pivot range.
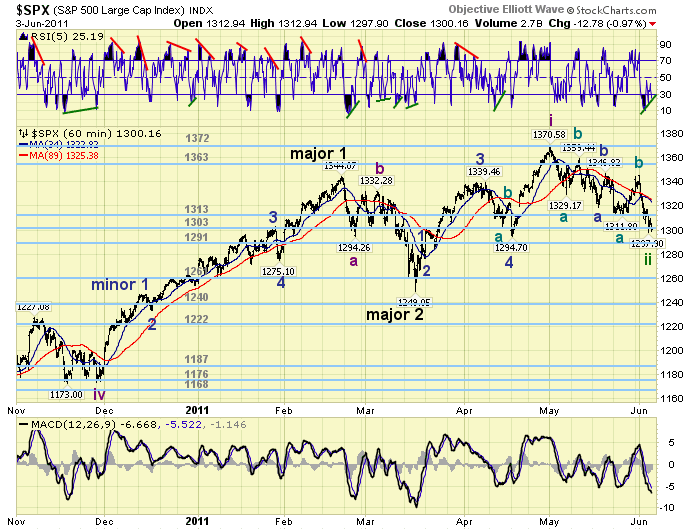
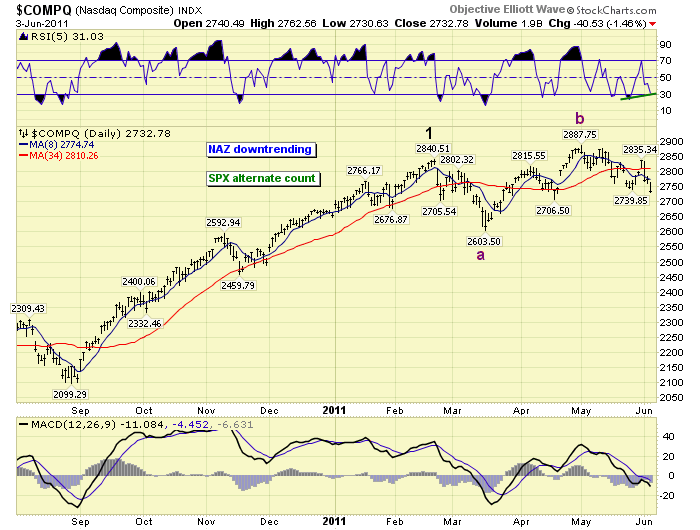
The short term OEW charts remain negative. Important support is at the 1291 OEW pivot. If this pivot breaks we’re likely headed to retesting the SPX 1249 March low. This SPX count is posted on the NAZ daily chart. Overhead resistance is now at SPX 1317, then the 1363 and 1372 pivots. Best to your trading!
FOREIGN MARKETS
Asian markets were mixed on the week for a net loss of 0.3%. All five are in downtrends.
European markets were mostly lower on the week for a net loss of 0.9%. All five here are in confirmed downtrends as well.
The Commodity equity group were all lower on the week for a net loss of 0.8%. All three of these indices are in downtrends.
The DJ World index is downtrending and lost 1.0% on the week.
COMMODITIES
During the first week of May commodities broke and then equities followed. This event also occurred in the first week of May 2010. The AGs, GKX are the first to confirm an uptrend.
Bond prices ave been uptrending and gained 0.7% on the week. 10YR yields dropped below 3.0% for the first time since early December.
Crude is downtrending and lost 0.2% on the week. We’re still expecting a decline below $93.
Gold is downtrending but gained 0.4% on the week. Despite the selloff in Silver, thus far, Gold has held up quite well.
The weakening uptrending USD lost 1.0% on the week for the second week in a row. This is usually an indication of an ongoing (unconfirmed) downtrend. The EUR gained 2.2% and the JPY gained 0.1%.
NEXT WEEK
A full five day trading week ahead but with few economic numbers. Tuesday we have Consumer credit, then wednesday the FED’s Beige book. On thursday, weekly Jobless claims, the Trade deficit and Wholesale inventories. Then on friday Import/Export prices and the Budget deficit. The FED has two speeches scheduled. On tuesday a speech by FED chairman Bernanke in Atlanta. Then on thursday a speech by FED vice chair Yellen at the Cleveland FED. Best to you and yours this weekend and week!
CHARTS: http://stockcharts.com/...
http://caldaroew.spaces.live.com
After about 40 years of investing in the markets one learns that the markets are constantly changing, not only in price, but in what drives the markets. In the 1960s, the Nifty Fifty were the leaders of the stock market. In the 1970s, stock selection using Technical Analysis was important, as the market stayed with a trading range for the entire decade. In the 1980s, the market finally broke out of it doldrums, as the DOW broke through 1100 in 1982, and launched the greatest bull market on record.
Sharing is an important aspect of a life. Over 100 people have joined our group, from all walks of life, covering twenty three countries across the globe. It's been the most fun I have ever had in the market. Sharing uncommon knowledge, with investors. In hope of aiding them in finding their financial independence.
Copyright © 2011 Tony Caldaro - All Rights Reserved Disclaimer: The above is a matter of opinion provided for general information purposes only and is not intended as investment advice. Information and analysis above are derived from sources and utilising methods believed to be reliable, but we cannot accept responsibility for any losses you may incur as a result of this analysis. Individuals should consult with their personal financial advisors.
© 2005-2022 http://www.MarketOracle.co.uk - The Market Oracle is a FREE Daily Financial Markets Analysis & Forecasting online publication.