


Dow Theory Stock Market Sell Signal May Be At Hand
Stock-Markets / Dow Theory Nov 21, 2007 - 12:51 PM GMT
 In my last article entitled, A Mere Correction or Reversal? I correctly identified the early beginnings of a reversal in motion. I also identified the next decline as a wave 3 or C and suggested it could be no shorter than 8 days, but could be as many as 13 or 21 days. Despite my preference for a 13-day decline, the Dow Jones Industrials (DJIA) had another 8-day decline. The cycle came early and set up the DJIA for yet another decline, a fifth wave.
In my earlier article, I had suggested that the third wave might be extended. This has not been the case, despite the fact that wave 1 was 790 points and wave 3 was 987 points. Wave 3 was simply behaving in typical Elliot Wave fashion by not being the smallest wave.
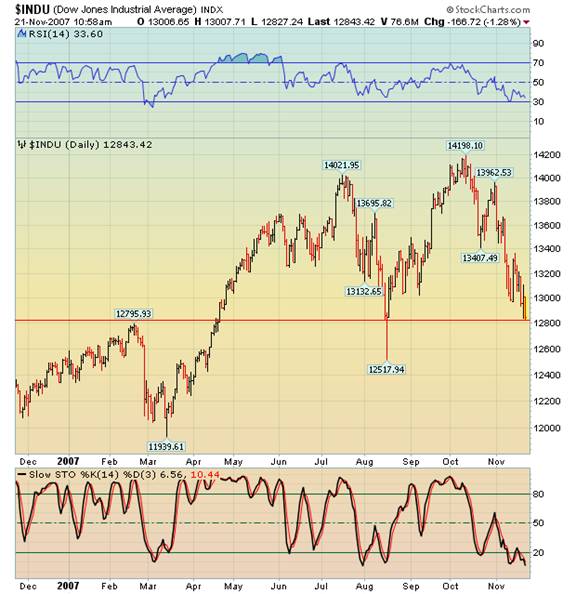
The question now is how to target this current wave (5) down. The minimum period of time that it should take is 8 days, since both waves 1 and 3 took the same amount of time. It is currently at an important support level, but the pattern does not appear to be complete.
Since neither waves 1 nor 3 has extended, then this leaves wave 5 as the best candidate for an extension below the current support. There are several methodologies for estimating the length of an extended wave, but the following is a methodology that I favor at present. The extension may be the sum of the distance from the top of wave 1 to the bottom of wave 3, which equals 1223 points. Subtract that sum from the top of wave 4 (13367) and the target may be 12144. Interestingly enough, Wave 3 is nearly 1.25 times the length of wave 1. Where wave 5 equals 1.25 times wave 3 is 1233 points, or a target of 12134. Please remember these are estimated targets, not promises. It may even be possible that the March 2007 low (11939.61) may be challenged in this decline.
This wave also is the best candidate for an extension of time, such as 13 or more days, as well, unless things really accelerate from here.
This agrees generally with my dynamic weekly support level of 12222. Dynamic support is not a trendline, but an algorithm that calculates where buying power comes into play. The dynamic support may be pierced on an intraday basis, but within a day or two, the DJIA may close at or near that level. It has the ability to become the baseline or consolidation area for the next rally.
What else has this decline accomplished? Assuming the August 16 th intraday low of 12517.64 is taken out (12845.78 on a closing basis), a Dow Theory Sell Signal appears ready to be triggered for the first time since 1999. That means the rally that ensues has a high likelihood of failure and at least one more substantial decline may follow. Another article may follow as the next phase develops.
We're on the air every Friday.
Tim Wood of www.cyclesman.com , John Grant and I have had a running commentary on the markets again this week. You may listen to our comments by clicking here .
Please make an appointment to discuss our investment strategies by calling Claire or Tony at (517) 699-1554, ext 10 or 11. Or e-mail us at tpi@thepracticalinvestor.com .
Regards,
Anthony M. Cherniawski,
President and CIO
http://www.thepracticalinvestor.com
As a State Registered Investment Advisor, The Practical Investor (TPI) manages private client investment portfolios using a proprietary investment strategy created by Chief Investment Officer Tony Cherniawski. Throughout 2000-01, when many investors felt the pain of double digit market losses, TPI successfully navigated the choppy investment waters, creating a profit for our private investment clients. With a focus on preserving assets and capitalizing on opportunities, TPI clients benefited greatly from the TPI strategies, allowing them to stay on track with their life goals
Disclaimer: The content in this article is written for educational and informational purposes only. There is no offer or recommendation to buy or sell any security and no information contained here should be interpreted or construed as investment advice. Do you own due diligence as the information in this article is the opinion of Anthony M. Cherniawski and subject to change without notice.
Anthony M. Cherniawski Archive |
© 2005-2022 http://www.MarketOracle.co.uk - The Market Oracle is a FREE Daily Financial Markets Analysis & Forecasting online publication.