


The Stock Market Good, the Bad, and the Ugly...
Stock-Markets / Stock Markets 2011 Jun 03, 2011 - 02:26 PM GMTBy: Marty_Chenard

 That's what we will look at this morning ...
Three charts, Three conditions ... Good, Bad, and Ugly which describe WHAT is happening in the market today.
The Good: For the first chart, we will visit the S&P 500 back to February 2010. The focus today should be on the red support line which has been in place for 8 months. That support line was tested again yesterday on its 4th. touch point. It survived with the index closing above the support.
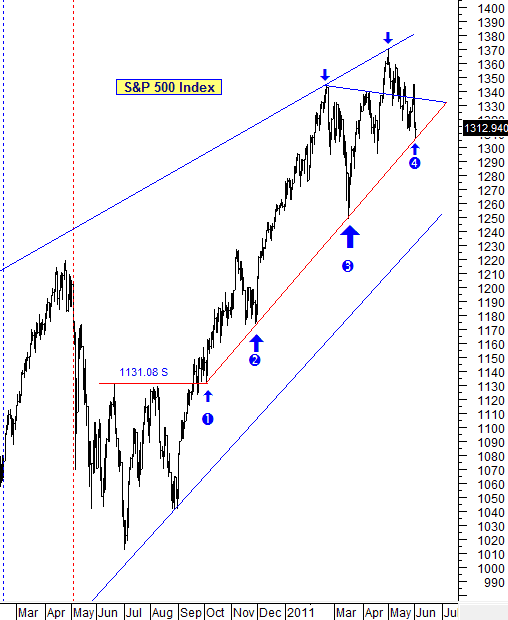
FYI ... Institutional Investors considered the S&P 500 to be the best indicator of the economy because it represents so many diverse sectors.
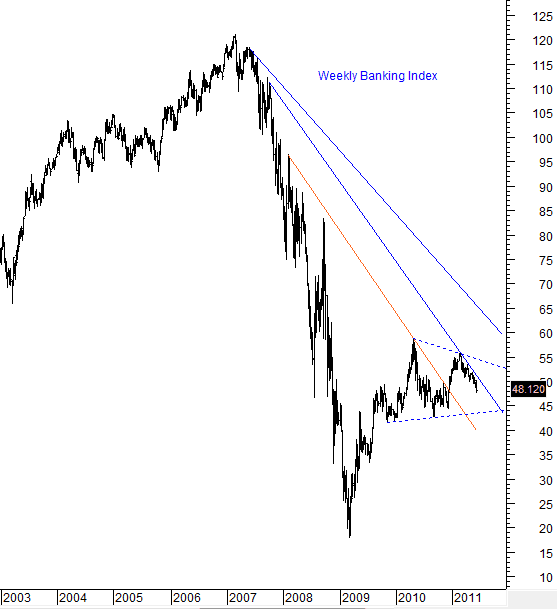
The Bad: Today we will focus on the S&P's second largest sector ... the Financial sector. The Financial sector represents 15.06% of the S&P, and the largest sector is Info Tech which represents 18.02% of the S&P.
Bottom line, the Financials have a large influence on the S&P 500 due to its weighting. So, let's look at the Banking index as a proxy for what is happening in that sector.
This weekly chart of the Banking index shows that it had peak in May of 2010, and it hasn't been able to even match that level since. Please see the next chart ...
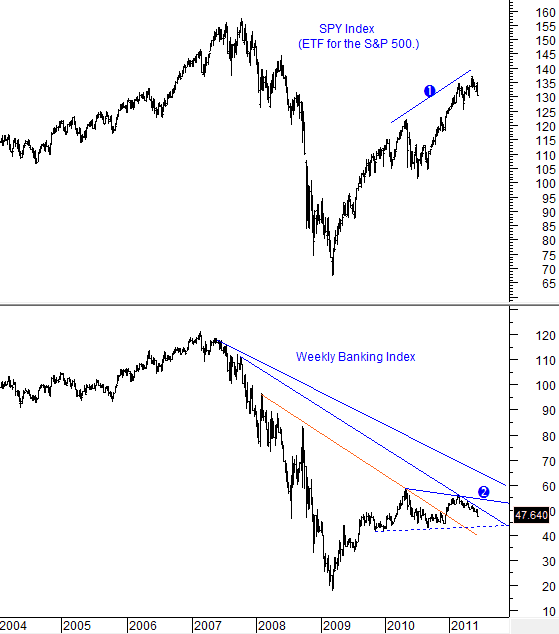
This next chart combines the first two charts on a weekly basis. Note the two lines labeled 1 and 2 on each index.
What becomes clear is that the S&P's rise has occurred with its second largest sector moving in the opposite direction. This negative divergence is an out-of-balance condition that will need to be rebalanced fairly soon by the markets. Please see the last chart ...
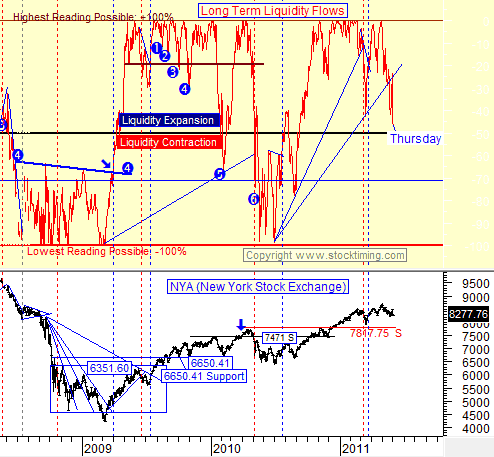
This next chart is posted on our paid subscriber site every day and is presented here as a courtesy to free members today ... In fairness to our paid subscribers, this chart will not be shown here again until sometime in July.
The Ugly: This chart measures Inflowing Liquidity on a daily basis. The stock market follows the direction of money. If money is pouring in and chasing stocks, the market goes up. When money is leaving the market, stocks get sold and the market goes down.
There are two major levels of Liquidity on this chart ... Expansion and Contraction. Bull Markets always have Liquidity in Expansion and Bear Markets have Liquidity in Contraction. So, as the S&P and Banking Index are out of balance, the market's Liquidity has been flowing out. This is a very dangerous condition that should be monitored and respected by all investors.
* Feel free to share this page with others by using the "Send this Page to a Friend" link below.
By Marty Chenard
http://www.stocktiming.com/
Please Note: We do not issue Buy or Sell timing recommendations on these Free daily update pages . I hope you understand, that in fairness, our Buy/Sell recommendations and advanced market Models are only available to our paid subscribers on a password required basis. Membership information
Marty Chenard is the Author and Teacher of two Seminar Courses on "Advanced Technical Analysis Investing", Mr. Chenard has been investing for over 30 years. In 2001 when the NASDAQ dropped 24.5%, his personal investment performance for the year was a gain of 57.428%. He is an Advanced Stock Market Technical Analyst that has developed his own proprietary analytical tools. As a result, he was out of the market two weeks before the 1987 Crash in the most recent Bear Market he faxed his Members in March 2000 telling them all to SELL. He is an advanced technical analyst and not an investment advisor, nor a securities broker.
Marty Chenard Archive |
© 2005-2022 http://www.MarketOracle.co.uk - The Market Oracle is a FREE Daily Financial Markets Analysis & Forecasting online publication.