


When To Sell Your Gold
Commodities / Gold and Silver 2011 May 28, 2011 - 03:11 PM GMTBy: Jan_Kaska

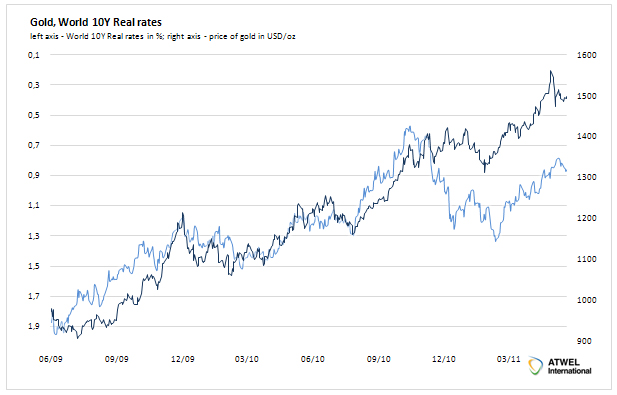
 Late last year, we were trying to short gold on the movement in world real rates. We had a beautiful chart, great correlation and a trade that should have performed magnificently (Chart 1). Yet, it did not. True, gold fell from 1400 to 1300, but nowhere near 1150 as we expected. As you can see on Chart 2, the correlations did not really break up, but the gold got boosted by some special alpha.
Chart 1
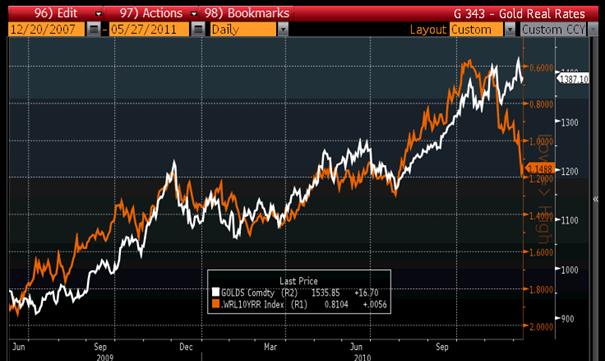
Chart 2
We do not like being treated by markets like that and had get into some more research what is driving gold price. We do know that marginal cost of production is around 600 USD/oz and there is very limited demand for industrial production, thus in fact, there must be about 900 USD put on the Fed and other central banks.
In order to keep things simple, we will not pay attention just to Fed, as it is still the main reserve central bank and besides, ECB is more hawkish, thus any strength in gold should be stemming primarily from Fed. The Asian central banks are also behind the curve, but have been hiking lately and are also partially dependent on Fed.
So what are the variables we are looking at that may drive gold? First, we naturally looked at real short term rates. If people are not compensated in the bank in real terms, they will start searching for other stores of value. Naturally, we could have tested different segments of yield curve or their combinations, not just real 3M T-Bill yields, but as we work with old-school excel to test our hypothesis, there is simply not enough will to do all the permutations by hand. We think 3M real yields as sufficient proxy to measure strength of debasement. We also work with historical CPI as we not buy into rational expectations theory.
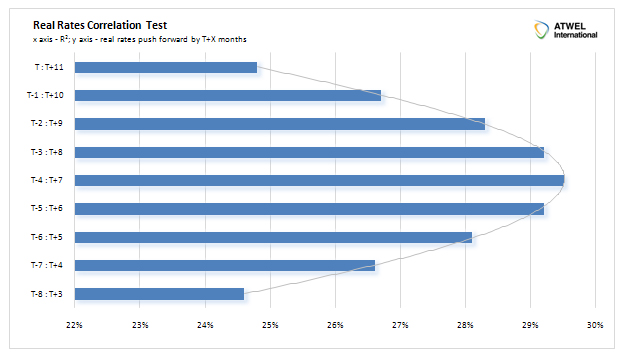
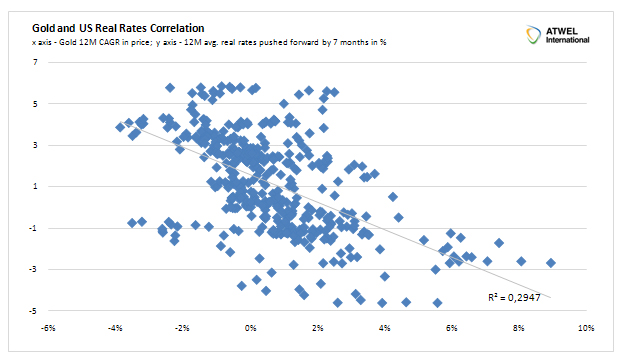
On Chart 3, we regressed monthly CAGR of gold prices over 12 months against 12M average real rate. Our recent experience tells us, that people were buying into gold as they knew Fed would remain on hold for long time (their QE2 program told in October that they will basically stay on hold for next 8 months and people like David Tepper would famously go "balls to the wall", flying on the money printing wave. Thus we also tested, if we can make our regression any better based on some kind of expectation proxy - here we used a small trick and pushed forward the real rates by couple of months, with 7 months lead giving us the best fit.
When we look at residuals and do the same correlation testing, we find strongest links between 12M absolute CPI change (probably due to the fact that everyone likes to look at annual changes), which means basically taking into account whether inflation is accelerating or decelerating and also , we find some minor, yet explanatory, relationship with broad trade-weighted USD. The reason why it is minor, is due to the fact that real rates and CPI moves drive currencies as well. What the model does not account for is any speculative positioning in the commodity exchanges, Asian factors, etc. We will try to upgrade the model by taking account these two into account, but for now, we need to get satisfied with overall R2=46%. The final regression equation for monthly CAGR of gold price over one year is :
Monthly CAGR of gold price over 1 year = 1.12% - 0.261% * (3M T-Bill - Headline CPI y/y)12M average of 7 months forward and 4 months historical + 0.299% * ( CPIT - CPIT-1) - 0.678 * 12M CAGR in Trade weighted US Dollar
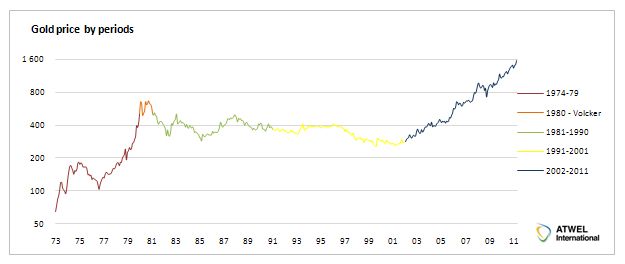
Before we start judging our model, we will have a look how gold did over certain major time periods. From 1973 to 1979 Keynesianism was in full swing and central banks helped to accommodate fiscal policy. 1980 was the period when Volcker came into office, yet gold and inflation mania was so entrenched, that despite hiking rates like crazy, not much really happened to price. 1981-1991 and 1991-2001 were periods when real rates were kept positive and gold corrected. Since 2000, Greenspan put and later Bernanke put were put into effect and you can see what the price did by yourself.
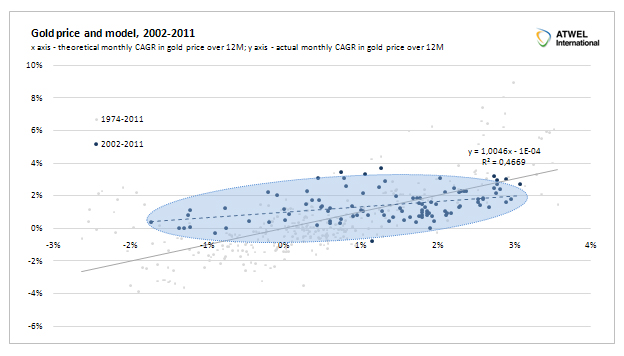
Now let us give you a hint how gold price has been evolving over time with respect to the model.
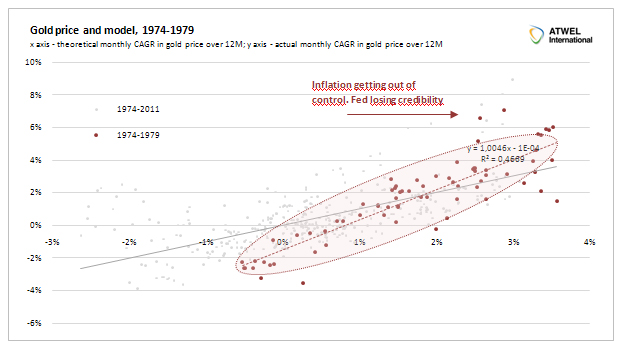
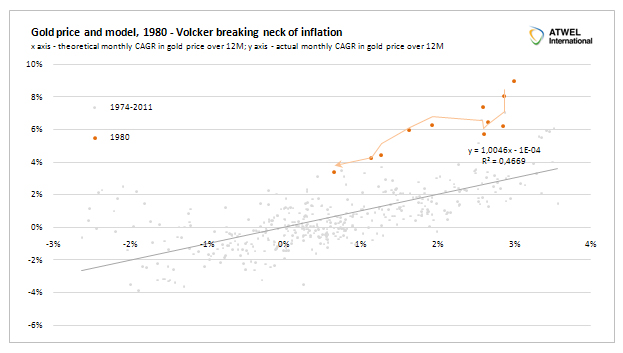
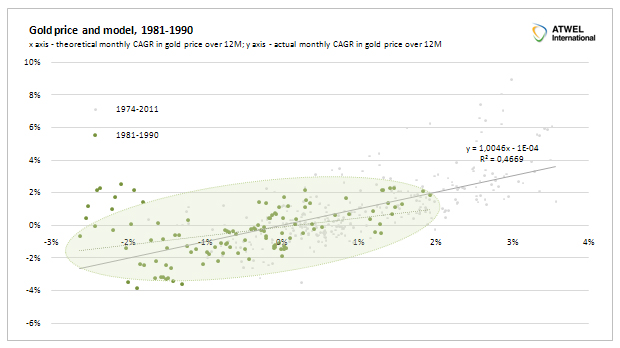
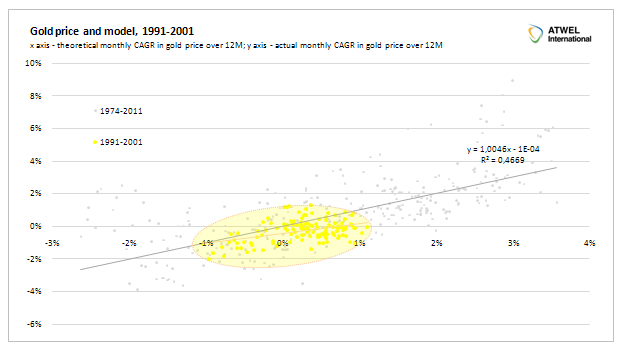
Chart 8 and 9 shows very good fit of the model, gold is doing exactly what it should as real rates were positive. On chart 10, we see some flattening of the 10 year linear regression and upward shift. That shows some tentative signs that markets are losing patience with US central bank.
Conclusion: We believe there will be continuous CPI increases in US stemming primarily from commodities and import price pressures from China. Let us assume for a while that we will get CPI stabilized at 2%, we will have stable USD and Fed will remain at zero yields for next year and half. With real rates at negative 2%, the equation is quite simple. Monthly price appreciation of gold should reach : 1.1% - 0.26% * (-2) = 1.1% + 0.52% = 1.62% p.m. = 21% p.a. over next year. Another scenario is to apply current yield curve which points to slow rate hikes early next year and reaching real rates equal to zero by early 2013. With broad USD dropping at the pace of just 2% due to rise of Asian currencies and CPI stable, we come down to our 1 year return on gold of 10-14% p.a.
It may look truly crazy to expect 10-21% p.a. appreciation in gold with just 2% CPI, but as gold has no physical impact on economy like oil, it can move quite freely. Also we think gold has little memory (little return-to-the-mean tendency and its returns are driven dominantly by real rates, CPI and USD) . If oil went up by 50% y/y today, it would crush world economy. On the other hand, if gold trades like a currency, it won't affect competitiveness of any nation. Gold is just a subject to demand with the supply being pretty stable.
Should we get continuous negative -2% real rates while economy grows at 2% p.a. in real terms, then more and more people will ask themselves why should I be a subject of continuous devaluation? There is a clear robbing of the saver going on. In case real rates start going up, we will get much more cautious on gold. But as of now, we would remain cautious buyers.
By Jan Kaska
Analyst with ATWEL International Hedge fund
© 2011 Copyright Jan Kaska, - All Rights Reserved
Disclaimer: The above is a matter of opinion provided for general information purposes only and is not intended as investment advice. Information and analysis above are derived from sources and utilising methods believed to be reliable, but we cannot accept responsibility for any losses you may incur as a result of this analysis. Individuals should consult with their personal financial advisors.
© 2005-2022 http://www.MarketOracle.co.uk - The Market Oracle is a FREE Daily Financial Markets Analysis & Forecasting online publication.