


Stock Market Wave Counts
Stock-Markets / Stock Markets 2011 May 21, 2011 - 07:44 AM GMT

 This week I want to spend some time on some long term views, as I have received some questions about my views to the long term trend. Whilst I am not really a fan of long wave term counts, we are following a couple of ideas.
I am sure there are readers asking themselves is this a bull or bear market?
By definition there can be no doubt that the past 2 years the markets have been a bull market in the sense that price has moved up, traders in my opinion should not be dazzled with the reasons why it's a bull market, but more interested in what price is doing.
However price is starting to show some cracks and whilst it started to look aggressively bullish a few weeks back, a lot has happened and there is some definite flaws with the aggressive bullish stance that many have adapted.
Price action is not lending itself to the aggressive nature you would expect if this was to be in what Elliotticians refer to as a "3rd of 3rd" in this case it would have been to the upside.
What we are seeing and especially since Feb 2011 is a bunch of noise and chop, which further supports the ideas I am showing here.
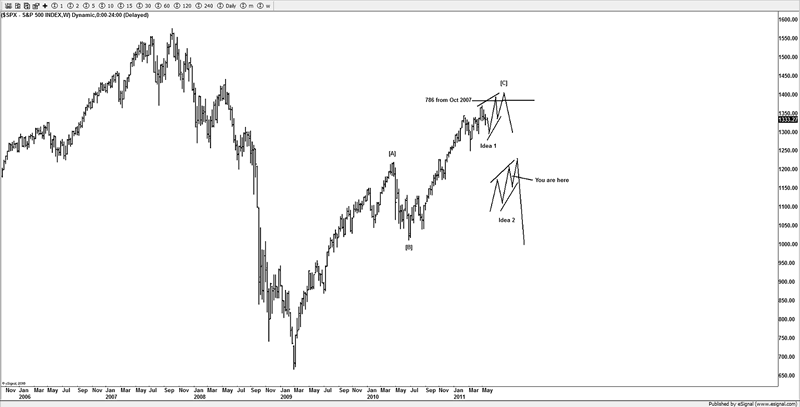
Now like everything in the markets, nothing is ever a definite, and we will adjust as necessary, but we are starting to see a clear image going on in the past few weeks, whilst this recent chop has been anything but friendly for traders, if you stand back and look at the big picture shown here, you can see the potential shape of wedge that could be signaling an impending reversal and one that could be ending the rally from March 2009.
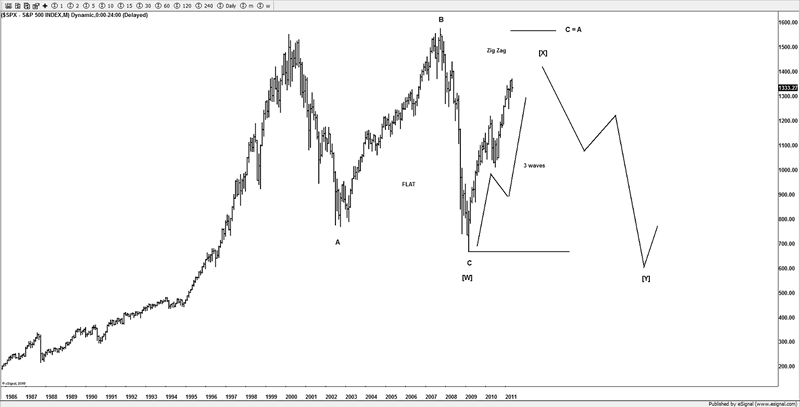
An alternative bearish wave count
This is not the general coconscious in the Elliott world, I am sure many readers are familiar with the DOW 1000 wave count and the end of the world wave count that some bears are following. Personally I am not really in that camp, overall it wouldn't make much difference as this idea shown here is suggest a trip back to the March 2009 lows.
Now Elliotticans that are reading this article or even readers with a grasp of Elliott wave theory will note the obvious 3 wave move from the March 2009 lows, what most important is what's going on now with price action. If you look carefully you will note the wedge potential of price action recently, that's showing a real battle ground taking place, and is generally associated with the top of a trend in a market, hence the potentials I will show in this article.
The bear case is that the market is still ongoing in a bear market, and I am sure readers are fully aware of the money printing and debt that many countries have took on over the past few years, and most know that the reasons why the market is where it is, it's because of POMOs and suchlike, as the US government via the FED is supporting the stock market, that's pretty much common knowledge, but again regardless of the reasons, price is still moving higher, just like back in 1999, the market simply shrugged off any cracks that were showing up until one day it fell apart, and again like back in 2007, the same setup, cracks were beginning to show back then, its most likely the same now, the market is not listening to the fundamentals of the real world, hence you can't use the fundamentals when trading price, which is why traders rely on technical analysis, as if you based your decision on trading the fundamentals you would have been run over with the path the markets have been on over the past 2 years.
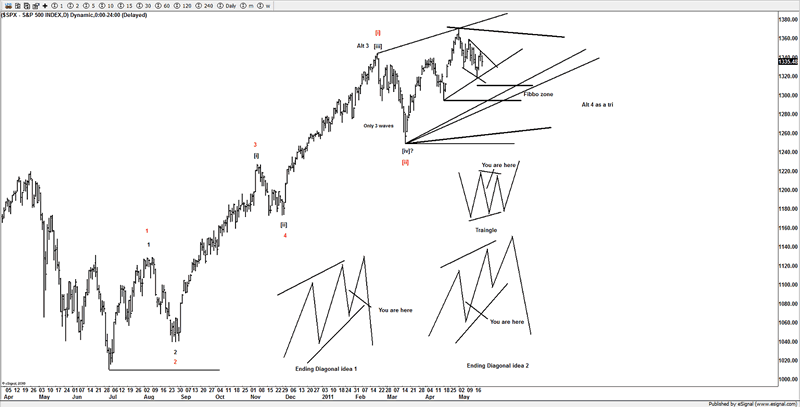
But now we are starting to see some cracks, you have seen that over the past few weeks from Feb 2011, when you look at a daily scale we notice the potential for this to start to wedge or a triangle, but we tend to think this has the makings of an ending diagonal taking shape. If price starts to wedge that's a bearish sign and the market is trying to signal the trend is coming to an end.
What traders need to be asking is, what is the shape that is going to take place here. Forget about the labels, they are only relevant to an experienced Elliottican. What's important is what price is doing, the past week has been one chop fest of whipsaw, and here is where it's important to look at what's going on in a larger time scale, if you look carefully, we have chopped around for a few weeks and no side is really getting the advantage.
What more important is what price is doing, it's not moving higher in an impulsive aggressive action as we saw before, that's a slight characteristic change, hence the aggressive bullish idea of seeing an imminent aggressive move higher is lacking in the right price action.
So the ideas that really standing out here, is a potential triangle or an ending diagonal (wedge).
The very fact we are seeing chop and whipsaw at the top of a trend is a characteristic of both those patterns, which further suggests, is that we are likely in a topping phase, as the bears and bulls are fighting it out, but the fact that's its gone from very aggressive upside to chop is a characteristic of one of those patterns and something that the bulls do need to be aware of.
Whilst we are still bullish here we are not as bullish as we was a few weeks back as we see the cracks here as the character has changed, so we are watching for which idea becomes favorite, both imply higher prices, but it's the chop and whipsaw that will become a problem for traders in the near term, we are already seeing 15 handle daily swings, you don't see that in aggressive bullish trends, you only have to look back to before the Feb 2011 high to see that day after day we saw straight up price action, that's the hallmark of an aggressive trend, not what we are seeing now.
As traders you can only trade what you see, but the predictability of using Elliott is its usefulness in patterns especially with patterns such as the ending diagonal or triangle.
The most recent example of an ending diagonal was on oil just a few week back before it literally fell apart.
If the market continues to overlap over the coming days and weeks, we suspect we have one of 2 patterns working, either a triangle which we rate at 35%, a potential ending diagonal, which we rate at 45% or the lows odds flat towards 1240SPX rated at 20%.
In order to really see an aggressive upside move here, it will need to do something special that is going to have to surprise traders, that means aggressive price action and buyers coming and buying with both hands, what we have seen recently is lack a luster performance, that's not something we wanted to see for an aggressive move, hence we are cautiously bullish and looking at one of the patterns above.
As shown above, here is what we think could be going on over the coming weeks, the clue is that price action continues chop around, and overlap, and more importantly starts to wedge, as that the key to the ending diagonal, lower volume, and less and less participation as the trend is coming to an end to reverse.
In order to get the trend back into the aggressive bull mode, it's going to need something far different than we have seen over the past few weeks, something like the back end of last year.
We still are bullish medium term, as it will need to do a lot more damage on the downside to suggest an aggressive bearish idea, but we are cautious and following one of 2 potential patterns as seen in this article.
FTSE & DAX
If you look at the recent price action of the DAX and FTSE, they both too have the potential for an ending diagonal, the aggressive idea of seeing a big move higher from here is looking weak, as the price action over the past few weeks is not something I would consider, is a characteristic of a "3rd of 3rd" it's more likely towards the end of a trend.
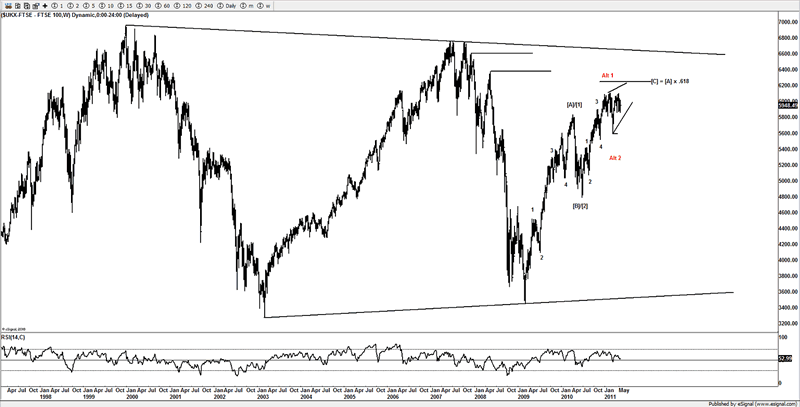
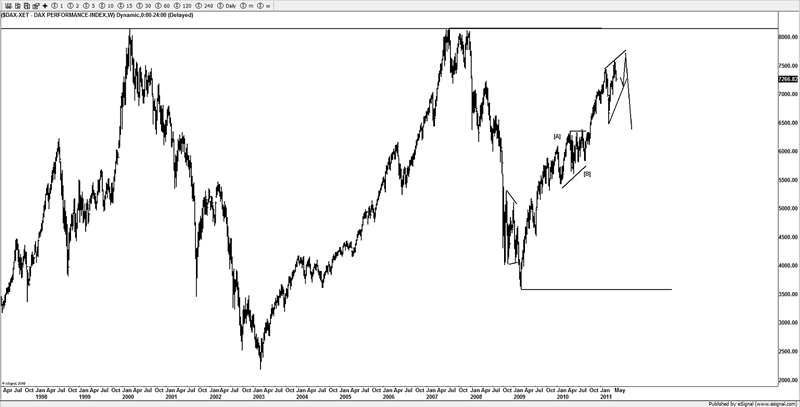
So we will be following price action over the coming days to see if they start to wedge to provide the clues we need to see if an ending diagonal setting up here over the coming weeks.
Until next time.
Have a profitable week ahead.
If you're looking to follow these markets and many others that we follow, then take advantage of the 4 week free trial, where you can then evaluate the site and see it fits in with your trading style.
Click here to become a member
You can also follow us on twitter
What do we offer?
Short and long term analysis on US and European markets, various major FX pairs, commodities from Gold and silver to markets like natural gas.
Daily analysis on where I think the market is going with key support and resistance areas, we move and adjust as the market adjusts.
A chat room where members can discuss ideas with me or other members.
Members get to know who is moving the markets in the S&P pits*
*I have permission to post comments from the audio I hear from the S&P pits.
If you looking for quality analysis from someone that actually looks at multiple charts and works hard at providing members information to stay on the right side of the trends and making $$$, why not give the site a trial.
If any of the readers want to see this article in a PDF format.
Please send an e-mail to Enquires@wavepatterntraders.com
Please put in the header PDF, or make it known that you want to be added to the mailing list for any future articles.
Or if you have any questions about becoming a member, please use the email address above.
If you like what you see, or want to see more of my work, then please sign up for the 4 week trial.
This article is just a small portion of the markets I follow.
I cover many markets, from FX to US equities, right the way through to commodities.
If I have the data I am more than willing to offer requests to members.
Currently new members can sign up for a 4 week free trial to test drive the site, and see if my work can help in your trading and if it meets your requirements.
If you don't like what you see, then drop me an email within the 1st 4 weeks from when you join, and ask for a no questions refund.
You simply have nothing to lose.
By Jason Soni AKA Nouf
© 2011 Copyright Jason Soni AKA Nouf - All Rights Reserved
Disclaimer: The above is a matter of opinion provided for general information purposes only and is not intended as investment advice. Information and analysis above are derived from sources and utilising methods believed to be reliable, but we cannot accept responsibility for any losses you may incur as a result of this analysis. Individuals should consult with their personal financial advisors.
© 2005-2022 http://www.MarketOracle.co.uk - The Market Oracle is a FREE Daily Financial Markets Analysis & Forecasting online publication.