


The Invisible Stock Bubble; Crash and Bear Market Ahead to S&P 400
Stock-Markets / Stocks Bear Market May 18, 2011 - 06:56 AM GMTBy: Mike_Shedlock

 As measured by current earnings, the stock market does not seem hugely overpriced. The question is will those earnings hold up?
SmartMoney associate editor Jack Hough addresses the question in The Invisible Stock Bubble
A new stock bubble might now be in the making, but this time the signs are less obvious. U.S. stocks, despite having racked up a decade worth of typical gains in the 26 months after their recessionary low, do not look expensive. The S&P 500 trades at 15.3 times trailing earnings, only a smidgen above its historic average of 14.5.
Those numbers might be luring investors toward a cliff, however. History suggests today's corporate earnings are unsustainably high relative to the size of the economy. The real price-to-earnings ratio, based on a more normal level of earnings, is well over 20.
To see why, consider a broad measure of America's prosperity called national income. It consists of corporate profits, worker wages, sole proprietor income and more. Corporations and workers compete against each other for income but also rely on each other for success. When profits and wages grow in tandem, the result is healthy economic expansion. When one grabs too large a slice of the nation's income pie, it usually signals a downturn waiting to happen.
For example, corporations since 1929 have collected an average of 6.4 cents per dollar of national income as after-tax profits. In 1966 corporate profits swelled to 8.3 cents per dollar of national income; they then fell 19% by the end of the decade. In 1997 they were 8.6 cents per dollar of national income; by the end of that decade they were down 13%.
Last year corporate profits reached 9.4 cents per dollar of national income. That's 47% too high by historic standards. If earnings were to shrink to their historic average, the aforementioned P-E ratio of 15.3 for the broad stock market would rise to nearly 23. The result would almost surely be a plunge in share prices.
After-Tax Corporate Taxes as % of Gross National Income
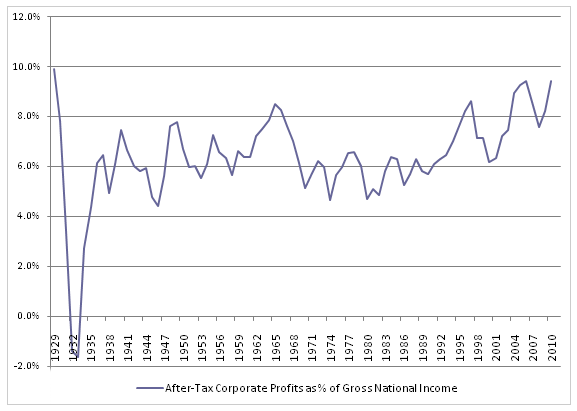
Corporate profits have commanded this large a share of national income only twice before: in 1929 and 2006. Those years preceded the past century's worst two financial collapses.
Normalized PE Ratios
SmartMoney also mentions (but not by name) "Normalized PE Ratios" something I have talked about several times recently.
Using a 10-year average of PE ratios, Robert Shiller pegs the normalized PE ratio of the S&P 500 at 24, an excessively rich valuation.
PE Compression
The article failed to mention the biggest driver of price, "PE Compression and Expansion."
Huge moves in the stock market come not from earnings, but rather from prices investors are willing to pay for those earnings. That was the case in 1929, 2000, and 2007. It was also true at bear market bottoms in numerous years where PE ratios collapsed to under 10.
For further discussion of Normalized PE ratios and Earnings compression, please see Negative Annualized Stock Market Returns for the Next 10 Years or Longer? It's Far More Likely Than You Think
As a follow-up post, please see Anatomy of Bubbles; Negative Returns for a Decade Revisited; Is Gold in a Bubble?
Russell Napier sees S&P Drop to 400
Finally, inquiring minds may wish to consider the video Long View: Historian sees S&P fall to 400.
Russell Napier warns the real bear market in the S&P has yet to come and that could push the S&P 500 index down to 400. The trigger for this event is related to emerging market debt yields. Click on link to play the video.
I do not have a target in mind as this setup can play out in a crash, in a long sideways move where earnings catch up to valuations, in a slow drift lower over many years, or a mini-crash followed by a lengthy sideways correction.
By Mike "Mish" Shedlock
http://globaleconomicanalysis.blogspot.com Click Here To Scroll Thru My Recent Post List
Mike Shedlock / Mish is a registered investment advisor representative for SitkaPacific Capital Management . Sitka Pacific is an asset management firm whose goal is strong performance and low volatility, regardless of market direction.
Visit Sitka Pacific's Account Management Page to learn more about wealth management and capital preservation strategies of Sitka Pacific.
I do weekly podcasts every Thursday on HoweStreet and a brief 7 minute segment on Saturday on CKNW AM 980 in Vancouver.
When not writing about stocks or the economy I spends a great deal of time on photography and in the garden. I have over 80 magazine and book cover credits. Some of my Wisconsin and gardening images can be seen at MichaelShedlock.com .
© 2011 Mike Shedlock, All Rights Reserved.
© 2005-2022 http://www.MarketOracle.co.uk - The Market Oracle is a FREE Daily Financial Markets Analysis & Forecasting online publication.
Comments
|
night knight
19 May 11, 04:35 |
wow, Mike
Mike, what happened to your December 09' call that 2010 would be a year of one big retracement? |