


Don't Be Fooled by Last Week's Stock Market Dip, U.S. Stocks Are Headed Higher
Stock-Markets / Stock Markets 2011 May 16, 2011 - 06:54 AM GMTBy: Money_Morning

 Jon D. Markman writes:
U.S. stocks struggled during a Friday the 13th week that was rigged like a haunted house with a trap door. The main problem for equities was strength in the dollar, which has the effect of undermining the value of commodities and, lately, stocks.
Jon D. Markman writes:
U.S. stocks struggled during a Friday the 13th week that was rigged like a haunted house with a trap door. The main problem for equities was strength in the dollar, which has the effect of undermining the value of commodities and, lately, stocks.
But don't worry there are some strong indications that the bull market in U.S. stocks is still very much intact.
It was not long ago that a stronger dollar was good for stocks. Now it's bad. And it wasn't long ago that falling commodity prices were good for stocks. Now that's bad too. Go figure.
The Standard & Poor's 500 Index fell 0.2% for the week, while the Dow Jones Industrial Average fell 0.3%, the Nasdaq Composite Index was flat and the Russell 2000 rose 0.3%. The meager final result was a disappointment because the indexes were up as much as 1% to 2.7% at midweek before they were hit by selling pressure.
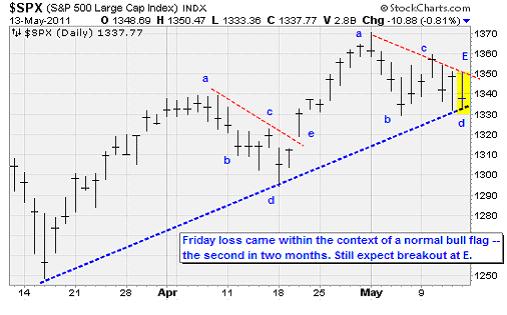
We have been talking a lot about the big, three-month pattern of the inverse head and shoulders on the S&P 500 and "the cup with handle" on the Nasdaq 100. But as you can see in the chart above, if you just look at the past two months we can also see two garden-variety bull flags. These are "continuation" patterns, which means that they are a brief correction or interruption of a broad uptrend.
An index hits a peak, slips back, trades up again to a lower high, trades back down to a lower low, and then on the fifth impulse trades back up to a point at which it exceeds its short-term downtrend. Then it is off and running toward a new high. It's by far the most prevalent pattern seen in bull markets.
That is what we see now. The next breakout should happen at the capital E, around 1,360, and that, in turn, should lead to a new high for the S&P 500 above 1,370. If that does not occur, and the next move is lower than 1,330, then we will know that a bigger correction is under way.
Although the week was flat, you still have to put it down in the win column for the bulls. Especially when you consider that it came despite another terrible set of sessions for Cisco Systems Inc. (Nasdaq: CSCO), an important member of both the Dow Jones Industrial Average and the Nasdaq 100. The company issued train wreck of an earnings report on Wednesday and is widely expected to soon lay off thousands of its highly paid workers.
While that is bad news for CSCO shareholders, it is a plus when indexes can shake off a poor showing from such a major component. It shows that there is a tone of underlying strength.
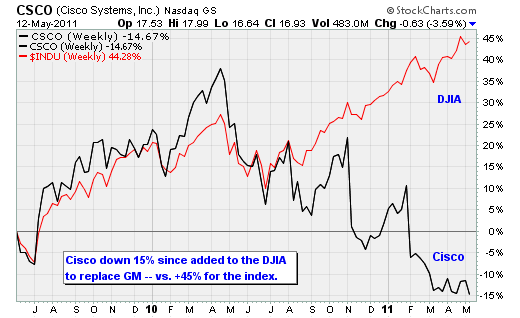
Let's stop here a minute to observe thatCisco is down 15% since it was added to the DJIA on June 6, 2009, to replace General Motors Co. (NYSE: GM). At the time, it was considered a real feather in the cap of technology stocks, because they had been shunned by the big index for so long. Cisco did well for the next year, but since April 2010, Cisco has been shellacked while the index has performed extremely well, as you can see above.
What's important to understand is that the Dow is seen, correctly, as a market benchmark. And yet it is really not much different than a choice of long-term stock picks by the editorial board of the Dow Jones company.
At the time the board added Cisco, it seemed like a logical choice. But just imagine that they had been more prescient and chosen to add Apple Inc. (Nasdaq: AAPL) or Amazon.com Inc. (Nasdaq: AMZN) instead to represent consumer-oriented technology rather than business-oriented technology. Amazon is up 140% since June 2009 and Apple is up 153%. The strength of either of those would have put the Dow close to around the 13,500 level than its current perch at 12,695.
And if we look at all the stocks in the Dow Jones Industrials 30, as well as the Dow Jones Transportation 20, we can see many great patterns are emerging even as Cisco is floundering. It looks to me as if the indexes are on the verge of a major new uptrend.
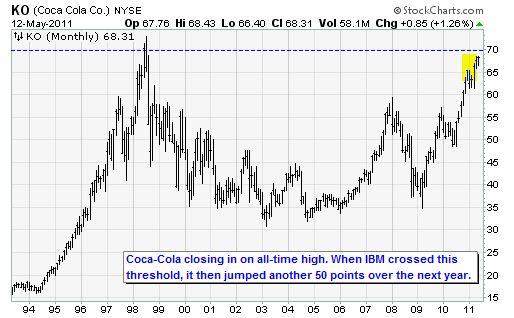
Consider the action in global consumer products giant The Coca-Cola Co. (NYSE: KO). In the long-term monthly chart above, you can see that Coke is approaching a high last seen in 1998. This means that despite all the growth that the company has witnessed globally in the past 13 years, anyone who bought the stock in 1998 has yet to seen any benefit.
The stock fell, like so many others, not because earnings were poor, because they weren't, but because its Price/Earnings (P/E) multiple contracted. This means that investors were less confident in Coca-Cola's ability to grow as much in the future as it had in the past. Well now we can see that investors are finally willing to ratchet up the company's P/E multiple a bit more, and the stock is finally levitating.
The old closing high for KO was $70, and the price now is $68.31. It is tempting to imagine that it will be repelled at that old level as investors who bought back then take the opportunity to finally unload the shares flat -- relieved that they did not take the 50% loss witnessed in 2003. But after those sellers are done, the most likely next step is for KO to trade much higher.
In doing so, it would follow in the footsteps of fellow DJIA component International Business Machines Corp. (NYSE: IBM), which rose 50 points in the year after exceeding its old 10-year high in December 2009.
Other DJIA stocks that are off and running in a new secular bull market -- meaning all-time highs -- are 3M Co. (NYSE: MMM), Caterpillar Inc. (NYSE: CAT), Verizon Communications Inc. (NYSE: VZ), Chevron Corp. (NYSE: CVX), The Travelers Cos. Inc. (NYSE: TRV) and United Technologies Corp. (NYSE: UTX), The Walt Disney Co. (NYSE: DIS), McDonalds Corp. (NYSE: MCD) and, just this week,Kraft Foods Inc. (NYSE: KFT) and Johnson & Johnson (NYSE: JNJ).
I do not think that the public, or even most professionals, realize that if you exclude a few large banks, techs and drug makers that are heavily weighted in the major indexes the rest of the market is in a raging secular bull market. Pfizer Inc. (NYSE: PFE) is making a strong comeback, and Intel Corp. (Nasdaq: INTC) is finally showing signs of life.
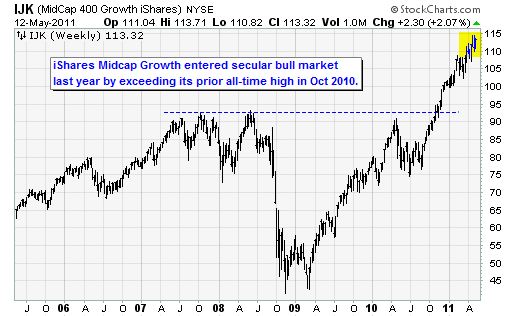
And thanks to the wonders of exchange-traded funds (ETFs), investors are no longer obligated to passively include the dogs of the market in their effort to own or trade passive indexes. This is one of the main reasons that I have encouraged subscribers to overweight the briskly advancing stocks in the iShares S&P Midcap 400 Growth Fund (NYSE: IJK). This is where the innovation and acceleration in the U.S. economy is centered, and that is where we want to be as investors.
At the same time, we need to tip our hat to the special new acceleration potential of consumer stocks like KO and JNJ as they cross the threshold into the secular bull market themselves.
Cumulative Breadth
The S&P 500 closed last week with better than 2:1 positive breadth for three sessions in a row, concluding Wednesday, which means that more than twice as many of its components were up than down. This measure of "cumulative breadth" helps us understand whether most stocks are participating in a rally, or if it is just a small leadership cadre.
Cumulative breadth of the benchmark index hit a fresh one-year high on Tuesday even though the index itself is still 6.5 points from the high set at the end of April.
You might intuitively consider this to be a bearish divergence, but it turns out that this is a very bullish condition. Market database whiz Rennie Yang reports that when this has occurred in the past, the index has almost invariably followed through with a new high within two weeks, and often much sooner. This makes it likely that the S&P 500 will reach a new high by the end of this month.
He has also found that when a month starts with two down sessions but ends higher, the first week of the next month is usually up by more than 1.5%.
The Week Ahead
May 16: Empire State Manufacturing Index (4/11).
May 17: Housing Starts (4/11). Industrial Production (4/11).
May 18: FOMC Meeting Minutes (April 26-27)
May 19: Initial Jobless Claims. Existing Home Sales (4/11). Leading Economic Indicators.
May 20: Nothing Scheduled.
[Editor's Note: Money Morning Contributing Writer Jon D. Markman has a unique view of both the world economy and the global financial markets. With uncertainty the watchword and volatility the norm in today's markets, low-risk/high-profit investments will be tougher than ever to find.
It will take a seasoned guide to uncover those opportunities.
Markman is that guide.
In the face of what's been the toughest market for investors since the Great Depression, it's time to sweep away the uncertainty and eradicate the worry. That's why investors subscribe to Markman's Strategic Advantage newsletter every week: He can see opportunity when other investors are blinded by worry.
Subscribe to Strategic Advantage and hire Markman to be your guide. For more information, please click here.]
Source :http://moneymorning.com/2011/05/16/...
Money Morning/The Money Map Report
©2011 Monument Street Publishing. All Rights Reserved. Protected by copyright laws of the United States and international treaties. Any reproduction, copying, or redistribution (electronic or otherwise, including on the world wide web), of content from this website, in whole or in part, is strictly prohibited without the express written permission of Monument Street Publishing. 105 West Monument Street, Baltimore MD 21201, Email: customerservice@moneymorning.com
Disclaimer: Nothing published by Money Morning should be considered personalized investment advice. Although our employees may answer your general customer service questions, they are not licensed under securities laws to address your particular investment situation. No communication by our employees to you should be deemed as personalized investent advice. We expressly forbid our writers from having a financial interest in any security recommended to our readers. All of our employees and agents must wait 24 hours after on-line publication, or 72 hours after the mailing of printed-only publication prior to following an initial recommendation. Any investments recommended by Money Morning should be made only after consulting with your investment advisor and only after reviewing the prospectus or financial statements of the company.
Money Morning Archive |
© 2005-2022 http://www.MarketOracle.co.uk - The Market Oracle is a FREE Daily Financial Markets Analysis & Forecasting online publication.