


Commodities Plunge Calls for Stock Market Contingency Plans
Stock-Markets / Financial Markets 2011 May 06, 2011 - 12:18 PM GMTBy: Chris_Ciovacco

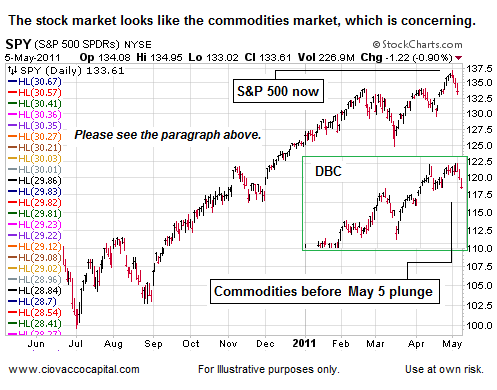
 While we still believe the S&P 500 can hit 1,400 to 1,440 sometime in 2011, the next few trading sessions are very important for intermediate-term outlook for stocks and commodities. If you own stocks you should be concerned about the May 5 plunge in the commodity markets. Why? Commodities, especially silver and copper, have been the leaders of the current bull market in risk assets. When the leaders of a bull market become weak, it is prudent to become concerned about the entire market.
While there are some significant bullish differences, the similarities between commodities before the May 5 plunge (see green box below) and the S&P 500 as of the May 5 close are concerning enough to continue to err on the side of playing defense and raising more cash in the event of further weakness. It is possible that falling commodity prices give stocks a lift, but it cannot hurt to be prepared and alert for general market weakness in the coming weeks. If stocks can move higher, we are happy to put defensive contingency plans on the back burner.
If the breakdowns in silver and commodities in general continue, it brings into question the viability of the current economic recovery and bull market in global stocks. Notice the last sentence began with if. As we will illustrate below using charts for a basket of commodities, there are reasons for concern and reasons to believe commodities may find their footing relatively soon, which in turn would be a positive for all risk and inflation-protection assets, including stocks.
We have been concerned about weakness in the energy sector and commodity markets in recent weeks. Copper (JJC) has been the weakest of the big four – oil, gold, silver and copper. Last week, we drew a line in the commodity sands by placing two stop loss orders on our remaining positions in copper (we have been net sellers of copper in 2011). Our strategy was to use copper as a possible warning sign of a general breakdown in the commodities complex.
Entering this week, we had a very small position in TBT (inverse Treasury bonds). We placed a stop-loss order last week on TBT as another shift-in-risk-tolerance alarm for both the stock and commodity markets. Weakness in TBT means market participants are buying defensive-oriented Treasuries. When bonds are going up in price, interest rates are going down – both indicate a defensive-minded bias in the markets (at least in the short-term).
Our first stop on copper/JJC was at 53.84 and the second at 53.02. JJC closed on May 4 at 54.39. The first trade on April 5 was 52.94, which triggered both our stops at the open. We got a price of 52.88 on both JJC sell orders, which highlights one of the limitations of using stops exclusively to protect your portfolio (something we do not do). Our execution price on both stops was well below the stop levels we entered with the orders. When the copper stops executed, it was a warning to pay attention to all our commodity positions, a warning we did not ignore.
Our second defensive-oriented warning came at 2:54 p.m. ET on May 5 when the line in the sand we drew for TBT was violated triggering our stop. The stops in copper and TBT factored into our decision to sell portions of our holdings in energy and commodity -related positions before the close on May 5.
A fair question is as follows:
If you were concerned enough to place stops on copper and TBT, why did you not cut back on your commodity and energy holdings before May 5?
First, as mentioned above we have been net sellers of copper in 2011 – so we have been cutting back. We have also been net sellers of energy stocks since early April. Second, commodities, especially silver and energy-related positions, are historically volatile. A 20% correction in silver is not all that uncommon within the context of a bull market. The way we have accounted for the volatility in silver is to have a small exposure to silver (SLV) relative to the size of our portfolios. Third, and maybe most importantly, as of the May 4 close, the commodities complex still remained well within the bounds of leave-it-alone territory.
The chart below shows a basket of commodities (DBC) as it looked when the markets closed on Wednesday, May 4. As one of many risk management tools, we have charts like the one below for all our major positions. While the chart looks complex, the basic concepts are easy to understand from a risk management standpoint. The thin horizontal colored lines represent areas of possible support based on the study of monthly, weekly, and daily charts dating back several years. The rationale for knowing where possible support lies is to avoid selling a position just before buyers step in and a market reverses (it happens if you do not do your homework). Notice as of the May 4 close, commodities had a significant band of support very close by – a support area that held in April 2011 (see point A). Point C shows that the basic uptrend off the November 2010 lows remained intact – another reason to remain patient with our positions.
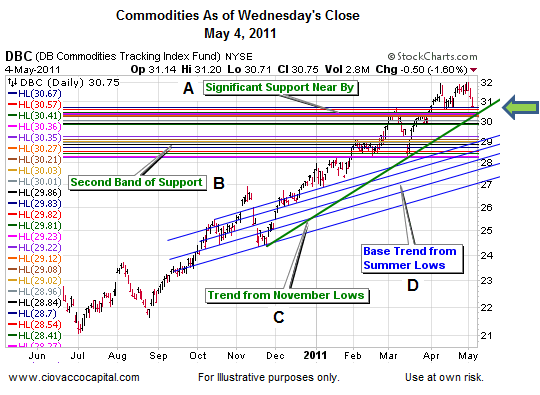
The outlook for commodities took a hit on Thursday, May 5. The close on May 4 is shown via the green arrow. The close on May 5 is shown via the blue arrow. The two major concerning developments were (1) the green trendline (see C) from the November 2010 lows was violated, and (2) the upper band of potential support was broken (see A). These developments, along with numerous other factors (slowing economic growth, the end of QE2, threat of rising interest rates, stops triggered for JJC and TBT, etc), prompted us to use the incremental approach to reduce our exposure to copper (JJC), silver (SLV), energy stocks (XLE), emerging markets (EEM), and commodities (DBC). We still own most of these positions - just not as much.
Now we will shift gears and move to some reasons to (a) have some hope commodities may stabilize soon and (b) maintain some exposure heading into the May 6 trading session. Referencing the chart above, the second band of horizontal support (see point B) is still in play – commodities found their footing there in February and March 2011. The more difficult reason for hope relative to managing risk relates to what we call the base trend from the summer 2010 lows (see blue lines near point D). Notice the early part of the trend off the summer lows is below the blue base trendlines and the more recent part of the trend is above the base trendlines. Using the concept of mean reversion, trends also tend to gravitate back toward their average or base trend. Even if the lower band of support breaks at point B, it would not be surprising for commodities to find support from buyers near one of the blue base trendlines (between $27 and $28 for DBC).
By Chris Ciovacco
Ciovacco Capital Management
Copyright (C) 2011 Ciovacco Capital Management, LLC All Rights Reserved.
Chris Ciovacco is the Chief Investment Officer for Ciovacco Capital Management, LLC. More on the web at www.ciovaccocapital.com
Ciovacco Capital Management, LLC is an independent money management firm based in Atlanta, Georgia. As a registered investment advisor, CCM helps individual investors, large & small; achieve improved investment results via independent research and globally diversified investment portfolios. Since we are a fee-based firm, our only objective is to help you protect and grow your assets. Our long-term, theme-oriented, buy-and-hold approach allows for portfolio rebalancing from time to time to adjust to new opportunities or changing market conditions. When looking at money managers in Atlanta, take a hard look at CCM.
All material presented herein is believed to be reliable but we cannot attest to its accuracy. Investment recommendations may change and readers are urged to check with their investment counselors and tax advisors before making any investment decisions. Opinions expressed in these reports may change without prior notice. This memorandum is based on information available to the public. No representation is made that it is accurate or complete. This memorandum is not an offer to buy or sell or a solicitation of an offer to buy or sell the securities mentioned. The investments discussed or recommended in this report may be unsuitable for investors depending on their specific investment objectives and financial position. Past performance is not necessarily a guide to future performance. The price or value of the investments to which this report relates, either directly or indirectly, may fall or rise against the interest of investors. All prices and yields contained in this report are subject to change without notice. This information is based on hypothetical assumptions and is intended for illustrative purposes only. THERE ARE NO WARRANTIES, EXPRESSED OR IMPLIED, AS TO ACCURACY, COMPLETENESS, OR RESULTS OBTAINED FROM ANY INFORMATION CONTAINED IN THIS ARTICLE. PAST PERFORMANCE DOES NOT GUARANTEE FUTURE RESULTS.
Chris Ciovacco Archive |
© 2005-2022 http://www.MarketOracle.co.uk - The Market Oracle is a FREE Daily Financial Markets Analysis & Forecasting online publication.