


Where Next for Gold,Silver and the Stock Market SP500 Index?
Commodities / Gold and Silver 2011 Apr 23, 2011 - 11:57 AM GMTBy: David_Banister

 The market action in both the precious metals complex and the equities markets has been moving in clearly defined Fibonacci and Elliott Wave patterns for quite some time now. All of the recent peaks and valleys in both areas can be clearly demarcated with Fibonacci retracements and crowd behavioral patterns both in advance and in hindsight. I’ve written about this phenomenon numerous times publicly and every week for my subscribers as well.
The Gold and Silver movements I outlined a few months ago well in advance of the current bull moves. I had suggested we would see 1525-1550 on Gold at the next interim peak back in late January from the 1310 lows. So far we have hit $1508 and near term $1518 is likely before a pullback to the 1480 ranges. Silver has run up to my 45-47 window that I forecasted back when Silver was in the mid $26 ranges. The question is then, what happens next?
Back in August of 2009 I forecasted that we were about to enter a very bullish five year window for the precious metals, and this is based on my theory of a 13 fibonacci year bull market that began in 2001. Crowds move in reliable patterns and my opinion is the movement we are seeing now is the biggest of the 13 year bull because there is “Crowd recognition”. Recall the huge bull market in tech stocks that began in 1986 and ended 13 years later in 1999 with a massive spike to 5000 on the NASDAQ. The final five years were the best for investors before the crash.
Looking at the current precious metals bull market, we are in year 10 now and it’s like 1997 in the Tech stocks. The best is still yet to come, but there will be peaks and valleys along the way as the Bull knocks everyone off the whole way up. Most recently at $1310 in January and only a few weeks ago at $1382 for instance. When I wrote the August 2009 article, gold was around $900 per ounce, and now it’s $1508. In August of 2010 I then forecasted that Silver was about to start a massive run from $19 per ounce, and since then we have rallied to near $47 in just 8-9 months. Silver is poor man’s gold, and my theory really was simply that investors as a herd would view Silver as “cheap” and rush to buy it relative to Gold which would be viewed as “expensive”. The bottom line is intermediately we are getting close to short term tops in both Silver and Gold, and corrections will ensue… but those will again be buying opportunities.
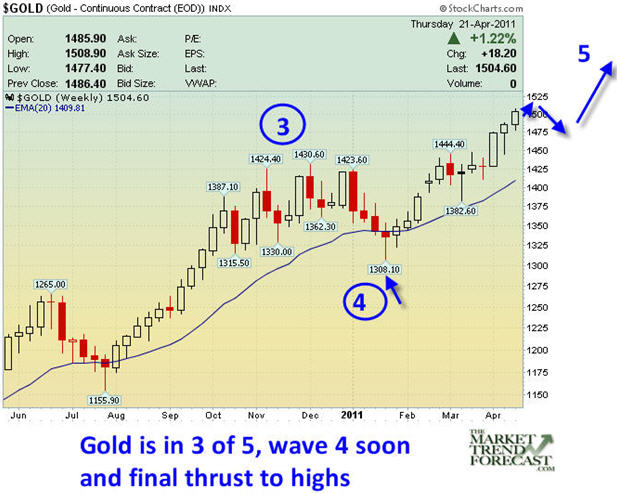
Below are my latest views on Gold and the near term direction:
The Equities markets are also in a multi-year bull market and in the most bullish of the phase as well. We began in March of 2009 and ran up for 13 Fibonacci months to April 2010 where I forecasted an interim top. Since then, we bottomed in July of 2010 in a wave 2 correction that was a 38% Fibonacci retracement of the 13 month rally. The rally to the 1343 highs was only wave 1 of a new 5 wave structure to the upside. The recent correction that surrounded the Japanese Earthquake was another wave 2 down in sentiment, only to be followed by a powerful rally of almost 100 points on the SP 500 index. This type of “shrugging off of bad news” reaction is typical of powerful major 3rd waves in Elliott Wave terms.
The most recent action bottomed at 1295 on the SP 500 and that was minor 2 down, and now what you will see if I’m right is a huge move to over 1400 on the SP 500 as the 3rd wave of this recent structure off the 1240 futures lows of March, begins to take hold. Strap on your seatbelts because this market is going to blast past 1400 and on to 1500 this year. You will also see the NASDAQ lead the charge and make a power move into the 3000’s as well.
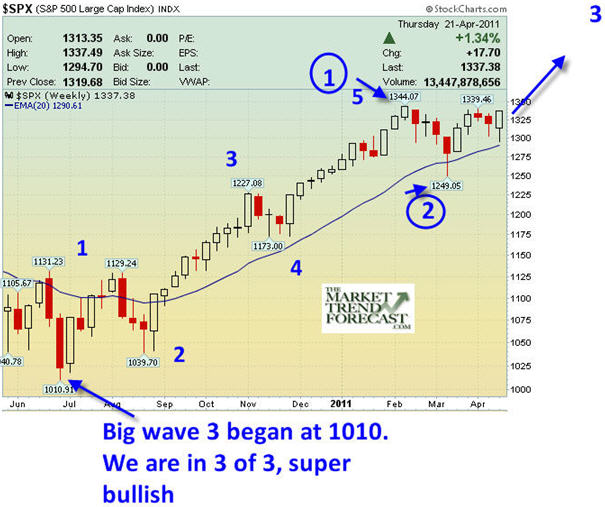
Below is my latest chart on the SP 500 Index:
I have not written an article or forecast publicly in a while as I prefer to keep this content for my paying subscribers, who get several updates a week on Silver, Gold, and the US markets. If you’d like to check it out, go to www.MarketTrendForecast.com and sign up for a discounted subscription and some free materials.
Dave Banister
CIO-Founder
Active Trading Partners, LLC
www.ActiveTradingPartners.com
TheMarketTrendForecast.com
Dave Banister is the Chief Investment Strategist and commentator for ActiveTradingPartners.com. David has written numerous market forecast articles on various sites (SafeHaven.Com, 321Gold.com, Gold-Eagle.com, TheStreet.Com etc. ) that have proven to be extremely accurate at major junctures.
© 2011 Copyright Dave Banister- All Rights Reserved
Disclaimer: The above is a matter of opinion provided for general information purposes only and is not intended as investment advice. Information and analysis above are derived from sources and utilising methods believed to be reliable, but we cannot accept responsibility for any losses you may incur as a result of this analysis. Individuals should consult with their personal financial advisors.
© 2005-2022 http://www.MarketOracle.co.uk - The Market Oracle is a FREE Daily Financial Markets Analysis & Forecasting online publication.