Stock Market Valuations Forming Second Biggest Bubble in US History
Stock-Markets / Stock Market Valuations Apr 11, 2011 - 03:42 PM GMTBy: Jason_Kaspar
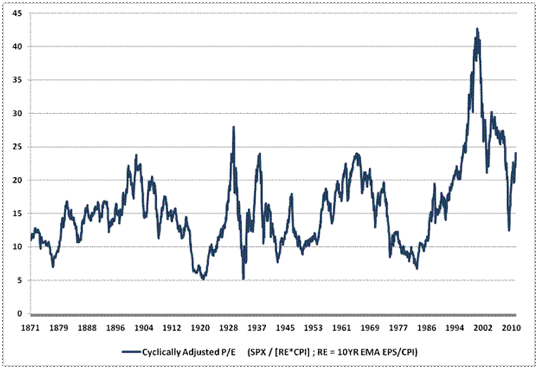
Despite the terrible economic performance of the past ten years (both in terms of the markets and the general economy), equity valuations are now approaching the second largest bubble in United States history, surpassed only by the technology bubble. Both the cause and the potential ramifications of this development are astounding.
This is not a “fad” valuation metric. CAPE dates back to 1871, offering 140 years worth of data, during which time the mean price-to-earnings ratio is 16. According to Yale University’s Dr. Robert Shiller, the market is now 41% overvalued according to this valuation metric. The only time the markets have been more overvalued was a few brief months in 1929 and the tech bubble.

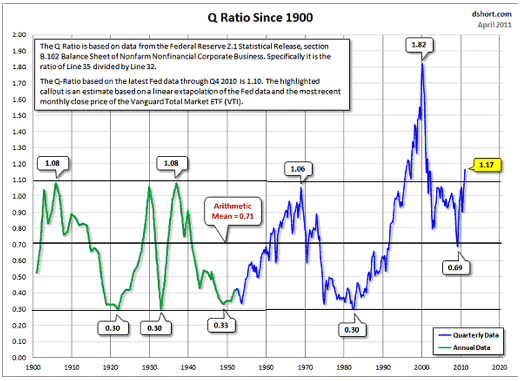
Exhibit 2: The Q ratio, which measures total market value compared to its replacement cost.
The Q-ratio data in the chart below dates back to 1900. According to the data, the markets have now surpassed the 1929 peak valuation by over 8%. In United States History, only the tech bubble was bigger than what we are experiencing today.

Historically, bubbles turn a believable story and a trend into an overvaluation. In the 1700s during the South Sea Bubble, the mania driving the bubble was the seemingly endless wealth and prosperity of the New World. Railroading prospects induced a bubble in the late 1800s as America became connected from the east coast to the west coast. In the 1920s, a bubble formed on belief in the newly formed League of Nations (world peace), and more importantly, the society-changing impact of the automobile. A similar life-changing invention – the Internet – swept the attention of investors in the 1990s as the prospect of a virtual marketplace would forever globalize commerce. Every bubble has a story, whether it be tulips or inventions or some other craze.
What is the story today? The prospect of inflation? High unemployment?
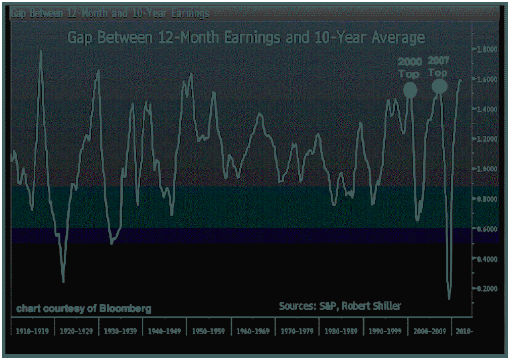
Exhibit 3: The gap between projected 12-month earnings against the 10-year average. (Two notes: a. the chart from Bloomberg fails to insert the word ‘projected’; Robert Shiller references this chart in this Bloomberg article. b. the 10-year average is the cyclically adjusted price to earnings ratio).
Considering the power of mean reversion, the market is stretching this reversion greater than 2000 and 2007!

Another question. Could the growth in earnings have been artificially manufactured?
To quote Elizabeth Barrett Browning: “Let me count the ways.”
- The change in accounting rules for the financial sector by FASB has generated massive “false” account profits beginning in 2009.
- The extended (and then further extended) unemployment benefits have kept an artificially higher demand for consumer consumption. As a result, the US government has artificially subsidized corporate profits.
- The billions saved through “free loading” by homeowners who have defaulted on their mortgages yet maintained their residence, thus living without a mortgage payment.
- The artificially suppressed interest rates.
So, not only do we have a valuation bubble, but the earnings on which the projections are based are non-sustaining, and non-market driven. Brilliant. Again, I am left wondering how it is possible to find ourselves in the same overvaluation situation as a few years ago especially considering nothing has been resolved to actually fix the world’s economic system.
A parting thought: according to research conducted by the Duke University Medical Center, it would seem that even monkeys are even capable of learning from their mistakes. Why can’t we?
Jason Kaspar blogs daily for www.GoldShark.com.
Jason is the Chief Investment Officer for Ark Fund Capital Management, focusing on investment and portfolio management. Jason founded a long/short value fund, Kaspar Investments, LP, in November 2007 along with its investment adviser, Dunamis Capital LLC. Prior to launching his fund, Jason was employed by Highland Capital Management LP, a then $40 billion hedge fund firm. Prior to joining Highland Capital, Jason worked for FTI Consulting, a global business advisory firm. At FTI Consulting, Jason worked within the corporate finance restructuring division and directly with the debtors and creditors involved in FTI's bankruptcy restructurings. Jason has built long lasting relationships with a broad base of private and institutional investors. Jason graduated Summa ***** Laude from Texas A&M with a double-degree in Finance & Accounting, where he was involved in numerous investment think-tanks focusing on investment strategy.
Twitter: www.twitter.com/kasparscomments
Website: www.arkfundcapital.com
© 2011 Copyright Jason Kaspar - All Rights Reserved
Disclaimer: The above is a matter of opinion provided for general information purposes only and is not intended as investment advice. Information and analysis above are derived from sources and utilising methods believed to be reliable, but we cannot accept responsibility for any losses you may incur as a result of this analysis. Individuals should consult with their personal financial advisors.
© 2005-2022 http://www.MarketOracle.co.uk - The Market Oracle is a FREE Daily Financial Markets Analysis & Forecasting online publication.


