


Stock Market Investing with Cycle and Bartels Theory
Stock-Markets / Cycles Analysis Apr 06, 2011 - 04:54 AM GMTBy: readtheticker

A stock price time series wiggles by nature. These wiggles may or may not be in tune. If they are in tune their common frequency can be called a 'cycle'. To determine the cycle period we can do several measures.
Eyeballs: Viewing the chart for common distance between highs and lows.
Mechanical Tools: Like the Ehrlich Cycle Finder
Maths: Bartels Significance Value .."Developed by Julius Bartels, a geophysicist who worked at the Carnegie Foundation in Washington in the 1930's. The advanced maths measures the stability of the amplitude and phase of each cycle. The method provides a direct measure of the likelihood that a given cycle is genuine and not random. The closer the cycle Bartels value is to zero, the less likelihood the cycle has been influenced by random events, and therefore significant to the data series. To conclude: The lower the 'Bartels value' the more significant the cycle to the price series sample used."... (Source: Jim Hurst Method)
What do we use? Answer all of the above. Yes, the Bartels method within the readtheticker.com cycle chart is the easiest method to manage a large portfolio, however all methods have merit.
Dominant cycles are not as easily found as support and resistance, trends, gaps and breakouts. Maybe this is the reason why many chartists fail to utilize their powerful readings. Cycles are a great friend to other technical analysis theories: Elliot Wave, Gann, Wyckoff, Dryfus, Turtle, etc.
The more you learn about cycles, the more you realize that cycles within a price time series are very timely with news events. This is because traders under go accumulation and distribution periods. Traders or the Richard Wyckoff 'composite man' accumulate stock float over a period to time, then pause as they realize they are bidding up the stock price against themselves, so they engineer a mild sell off (with a bearish news event), then continue the accumulation. The result will be very tradeable cycles. Alcoa (AA) is a great example of periods of accumulation and distributions as price step ladders up to new highs.
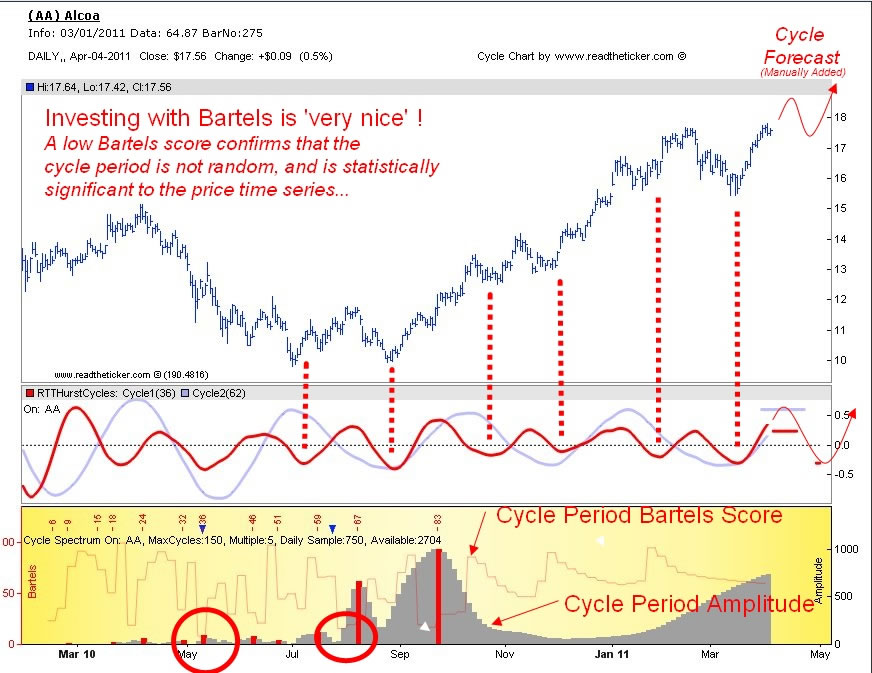
NOTE: The dotted lines, text and forecast are annotations via Paint.net
The chart shows the Bartels value is low for cycle periods: 36, 62-66, 78-82. I have drawn cycles for 36 and 62 periods. You can choose cycles with low Bartels and high amplitude, but its best to select cycles that fit the chart via the eyeball test. We use the Cycle Spectrum as a guide to find the upper percentile of significant cycle periods.
The last Alcoa(AA) price swing down was on the news of the 2011 earthquake in Japan, yet it was very timely with the 36 period cycle. I am not suggesting there are magical powers are at work, however I am suggesting when you have a statistically significant cycle at hand and you should exploit it for profit, no matter the news.
The current cycle is topping out. We are waiting for the next swing down for another call option play.
Readtheticker
My website: www.readtheticker.com
My blog: http://www.readtheticker.com/Pages/Blog1.aspx
We are financial market enthusiast using methods expressed by the Gann, Hurst and Wyckoff with a few of our own proprietary tools. Readtheticker.com provides online stock and index charts with commentary. We are not brokers, bankers, financial planners, hedge fund traders or investment advisors, we are private investors
© 2011 Copyright readtheticker - All Rights Reserved
Disclaimer: The material is presented for educational purposes only and may contain errors or omissions and are subject to change without notice. Readtheticker.com (or 'RTT') members and or associates are NOT responsible for any actions you may take on any comments, advice,annotations or advertisement presented in this content. This material is not presented to be a recommendation to buy or sell any financial instrument (including but not limited to stocks, forex, options, bonds or futures, on any exchange in the world) or as 'investment advice'. Readtheticker.com members may have a position in any company or security mentioned herein.
© 2005-2022 http://www.MarketOracle.co.uk - The Market Oracle is a FREE Daily Financial Markets Analysis & Forecasting online publication.