U.S. Dollar and Stock Market Trend Relationship, Currency and Real Wars
Stock-Markets / Stock Markets 2011 Mar 31, 2011 - 12:07 PM GMTBy: Nadeem_Walayat

 This analysis seeks to determine the impact of the USD index on the stock market trend, which forms part of a series of analysis that is working towards formulating a detailed trend forecast for the stock market for the remainder of 2011.
The consensus view is that a rising US Dollar is bearish for the stock market whilst a falling Dollar is bullish. The below graph illustrates that more or less this has been the trend relationship between the two markets for the past 10 years.
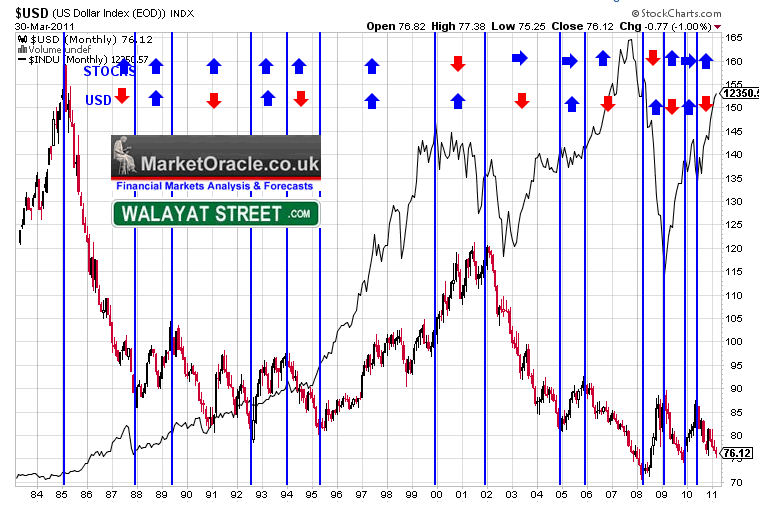
However the earlier trend of the 1980's and 1990's shows a conflicting picture where for significant lengths of time the dollar and stocks both trended in the same direction, usually both upwards which coincides with periods of strong economic growth when the U.S. was a favoured investment destination thus demand for US assets and stocks was high which in large part fed the likes of the dot com bubble. Off course when economic growth is strong the central bank does not need to print money to buy assets and monetize government debt as deficits are small or even in surplus as the Clinton years witnessed.
But for now the key trend remains for that of a weak dollar as supportive of stocks and strong dollar as a negative for the stock market.
The Currency Wars Big Secret
The mainstream press periodically obsesses over China and others for manipulating their currency exchange rates against the U.S. Dollar that is painted as the innocent victim, U.S. politicians with self righteous indignation call for action to be taken against the evil currency manipulators. When in actual fact the likes of the Chinese are more like rabbits frozen by fear in the face of the Feds headlights, trying hard not to become road kill in the face of Fed actions and the U.S. Congress's near endless deficit spending debt accumulating binge that is debasing the worlds reserve currency.
Contrary to the way the financial world may be presented in the mainstream media, the Fed is at the head of the global central banking syndicate that runs the show Don Vito Corleone style, where should any foreign central banks get out of line, will soon be in for a currency markets massacre as they see their currencies soar against the dollar and thus destroying their ability to export, which their economies are addicted to drug addicts style, as the official policy of the U.S. since the midst of the cold war has been to control the worlds financial system by means of operating a continuous large trade deficit, as covered at length in the October 2010 article (12 Oct 2010 - USD Index Trend Forecast Into Mid 2011, U.S. Dollar Collapse (Again)?).
Whilst many in the mainstream press have finally clocked onto the fact that the Fed intends to inflate (about a 18 months behind the curve), what no one appears to have clocked onto so far is that the BIG SECRET is that the Fed intends on INFLATING THE WHOLE WORLD ! It is pushing the worlds governments reliant on exporting to the U.S. into devaluing their currencies by means of printing money (See Ebook QE section).
Thus against the Fed INFLATE or DIE policy, all foreign central banks are fighting hard to maintain their pegs to the downwards spiraling U.S. Dollar, which effectively means that all currencies are spiraling lower hence the whole world is inflating at the Feds whim. For instance emerging markets such as Brazil repeatedly cry out that they are being flooded with too much foreign capital that is driving up their currencies, therefore they are forced to print and debase their own currencies i.e. INFLATE! (are you listening delusional deflationists ?) THE FED IS INFLATING THE WHOLE WORLD!
 How can the US Fed get away with printing money and inflating the whole world ?
You may wonder that the dollar's strength (lack of collapse) in the face of money printing and ever expanding debt accumulation is as a consequence of underlying US economic strength or huge amounts of (Invisible) gold reserves at Fort Knox. The real reason why the US is able to get sway with printing unlimited amounts of money is the US Military, as the US remains the worlds sole hyper military power following the collapse of the soviet union and increasingly relies on global military power to back up the dollar as the worlds primary means of exchange, as any country that chooses not to comply will likely be on the receiving end of a 1000 tomahawk cruise missiles as Libya is experiencing today or even worse as Iraq has experienced during the past 8 years.
The U.S. Military Empire targets all those bastions of mediums of exchange that compete against the dollar, which is why the literally super sweet oil rich state of Libya presents such an ideal target for not just the U.S. but also the competing imperialists of Britain and France, regardless of the fact that they are choosing to back and about to arm rebels of North East Libya, an area that ranks as the Al-Qeeda recruitment capital of the world (as a proportion of population) as per the 31 page West Point Study that analysed the backgrounds of captured foreign guerrilla fighters in Iraq during 2006-2007.
Unfortunately, the death of all empires comes in the form of a short-lived super nova explosions of military expenditures, which is the path that the US appears to have chosen and hence the tendency to increasingly use shock and awe military force around the globe as the military industrial complex remains the only significant growth industry to restock the missiles and bombs and equipment expended.
U.S. Dollar Trend Forecast and the Dow Stocks Index
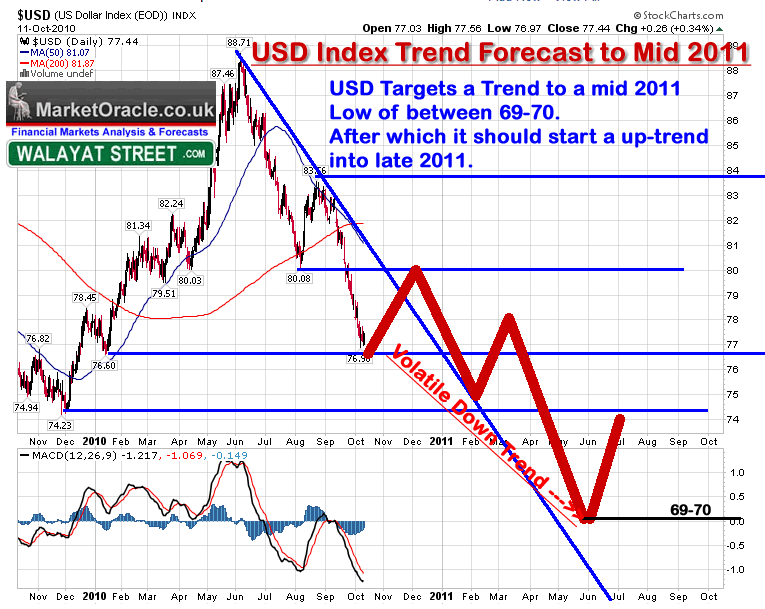
My long standing USD analysis (12 Oct 2010 - USD Index Trend Forecast Into Mid 2011, U.S. Dollar Collapse (Again)? ) concluded in the following trend expectation for the U.S. Dollar into mid 2011 in that it targets a mid 2011 low of around 69-70. Currently the USD index stands at 76 which puts the trend firmly inline with the forecast expectations of some 5 months ago of where it would be by now which therefore does not require new in-depth analysis.
The impact of a falling USD on the stock market is two fold.
1. It inflates the dollar value of US stocks as they fall in value in foreign currencies.
2. It inflates the dollar value of foreign earnings and hence boosts U.S. corporate earnings.
Both of these are positives for stock market, which considering the above forecast for an orderly USD down-trend therefore continues to support a stocks bull market trend into at least mid 2011. Thereafter the dollar can be expected to bounce which implies stocks trend could be more muted.
Conclusion - The above analysis suggests a bullish stocks trend into mid 2011, thereafter weaker stocks trend associated with a dollar bounce into perhaps mid September. Then keeping in mind that the USD is in a longer term bear market (continuing monster US budget deficit) which suggests that the USD can be expected to at least retest and more probably break the mid 2011 low before the end of the year would be bullish for the stock market during Q4.
Though bear in mind, that as occurred during the 1990's a strong U.S. Economy would CHANGE the dollar stock market relationship, where BOTH could rise together.
Stock Market Trend Forecast for 2011
This analysis forms part of ongoing in-depth analysis that will be published imminently (within the next day or so) both first as a condensed web article to enable posting and secondly as an comprehensive ebook (a few days later). Ensure you are subscribed to my always free newsletter to get these in your email in box.
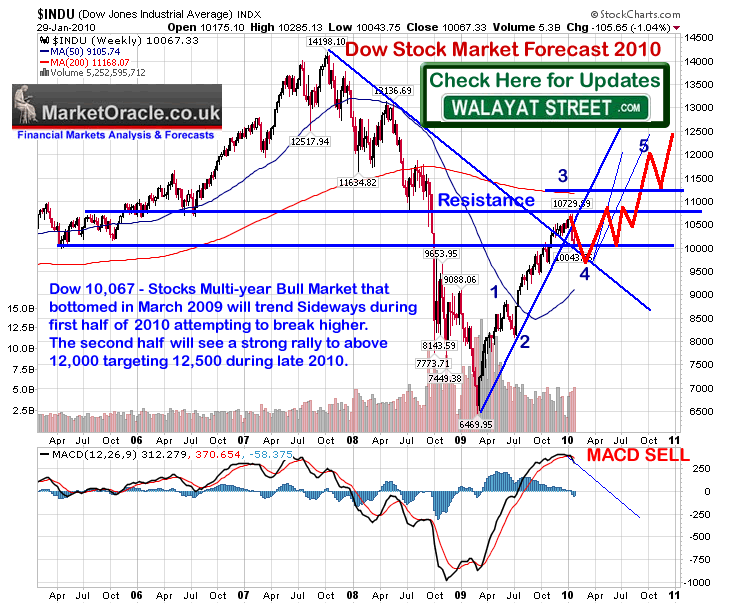
Recap of Stock Market Trend Forecast for 2010 - 02 Feb 2010 - Stocks Stealth Bull Market Trend Forecast For 2010
Dow 10,067 - Stocks Multi-year Bull Market that bottomed in March 2009 will trend Sideways during first half of 2010 attempting to break higher. The second half will see a strong rally to above 12,000 targeting 12,500 during late 2010.
Your unbiased stock index trading analyst.
Source and Comments: http://www.marketoracle.co.uk/Article27285.html
By Nadeem Walayat
Copyright © 2005-2011 Marketoracle.co.uk (Market Oracle Ltd). All rights reserved.
 Nadeem Walayat has over 25 years experience of trading derivatives, portfolio management and analysing the financial markets, including one of few who both anticipated and Beat the 1987 Crash. Nadeem's forward looking analysis focuses on UK inflation, economy, interest rates and housing market. He is the author of two ebook's - The Inflation Mega-Trend(Jan 2010) and The Interest Rate Mega-Trend(Mar 2011) that can be downloaded for Free. Nadeem is the Editor of The Market Oracle, a FREE Daily Financial Markets Analysis & Forecasting online publication that presents in-depth analysis from over 600 experienced analysts on a range of views of the probable direction of the financial markets, thus enabling our readers to arrive at an informed opinion on future market direction. http://www.marketoracle.co.uk
Disclaimer: The above is a matter of opinion provided for general information purposes only and is not intended as investment advice. Information and analysis above are derived from sources and utilising methods believed to be reliable, but we cannot accept responsibility for any trading losses you may incur as a result of this analysis. Individuals should consult with their personal financial advisors before engaging in any trading activities.
Nadeem Walayat Archive |
© 2005-2022 http://www.MarketOracle.co.uk - The Market Oracle is a FREE Daily Financial Markets Analysis & Forecasting online publication.
Comments
|
Nasir
01 Apr 11, 08:30 |
Dow Technical Analysis
Hi Nadeem, if you look at weekly charts of the Dow and S&P 500, with MACD, you can see that after this recent correction, the markets appear to be making a divergence on the MACD for the weekly charts. When this divergence is seen with extended RSI (Overbrought) it usually signals a major sell signal. This signal was seen in 2000 and 2007, However false signals were given in 2004, and recently last year in summer 2010. Now the divergence signal is forming again on the weekly charts, surely it we can't have another failed signal? Do you also look at Advance/Decline issues to find a market top? I noticed there are massive spikes in new lows at market tops. Perhaps the forming divergence may just lead to a correction. However it is all in line with what you are predicting, a 2 month or so rally followed by correction. Also 1400 on S&P 500 apppears to be massive resistence. Nasir |
|
MWJ
13 Sep 11, 04:16 |
USD prediction totally incorrect!
Sorry Nadeem, you are totally wrong on the USD....the USD index in 2011 has not fallen to 69 but climbed to 78 as the Fed refuses to embrace QE3. The world has already ENTERED the Great Depression so the USD is likely to skyrocket from here!! I advise all readers to SELL SELL SELL before it's too late. |
|
Nadeem_Walayat
13 Sep 11, 12:55 |
U.S. Dollar Trend Forecast
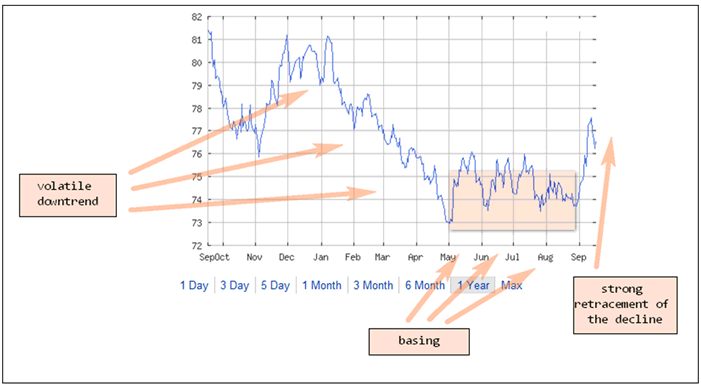
Hi My last indepth analysis forecast for the USD was in October 2010 - 12 Oct 2010 - USD Index Trend Forecast Into Mid 2011, U.S. Dollar Collapse (Again)? This is what I concluded in Ocober 2010 - USD Index Forecast Final Conclusion The USD index is targeting a trend to a new all time low in the region of USD 69-70 by mid 2011, that will be followed by a strong rally that could see the Dollar retrace all of the decline back towards USD 80. The problem is with the timing of these trends as volatility will be high. It's a tough exercise but I conclude in the USD taking some time to base following the mid 2011 low before the subsequent bounce to 80 takes place. Therefore the forecast trend is USD 69-70 by mid 2011 followed by a bounce to 80 by October 2011. The immediate future is suggestive of an imminent bounce towards 80 by early December before the final swing lower to a new all time low takes place as illustrated by the below forecast trend graph.
Actual trend ? The dollar started to deviate from my trend in April 2011, and yes failed to reach 69-70 by mid 2011, but the strong rally IS taking place. Remember we are talkign about analysis and a forecast trend of approaching a year ago ! That was very accurate for the first 6 months. Realistically I am pushing the envelope a great deal when I start to go over 2 months forward for markets suchas forex and stocks, therefore 6 months of accuracy is more than I could possibly ask for at the time, I'm more than happy as it allowed to plan ahead and make portfolio decisions with certainty for many inter-markets during that time period, which is the primary purpose for my analysis i.e. to give me firm conclusions to act on and road maps against which to measure strength and weakness, so as to not waste time time double guessing myself. Perhaps I should have revisted the USD April / May but my focus has been on housing since April / May. Best NW |
|
Paul
18 Sep 11, 03:01 |
when you're good
Once in a while it pays to step back from all the constant noise and take a Specific numbers/timing shouldn't matter to those more interested in Sometimes Nadeem, sometimes, you are a legend. Best Paul On 12 October 2010 you wrote -------------- USD Index Forecast Final Conclusion The USD index is targeting a trend to a new all time low in the region of
-------------- Your chart compared to a few annotations of mine. A note on my charting
|