


Nasdaq Bubble, Real-Estate Bubble... Silver Bubble?
Commodities / Gold and Silver 2011 Mar 31, 2011 - 05:20 AM GMT

 Is silver in a bubble? In our opinion; no. But what can we learn from past bubbles? There are many ways to detect an investment bubble including extreme positive market sentiment, outrageous demand and speculation, widespread mainstream acceptance that the investment is a “sure thing” etc. In this article we would like to focus on the big picture perspective of a markets price performance.
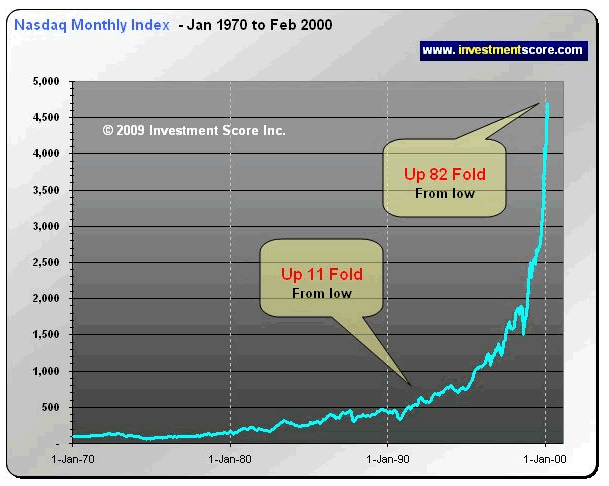
The above chart clearly illustrates what a genuine, parabolic, investment mania, or bubble, can look like. Note the following:
- The “mega spike” climbed to about 4,572 which is about an 82 fold increase from its low. That is an increase of 8,200% without including dividends.
- All previous highs are not even close to the ultimate blow off high.
- In 1992 the Nasdaq was up a whopping 11 fold and it appeared to be in the process of putting in a parabolic blow off spike.
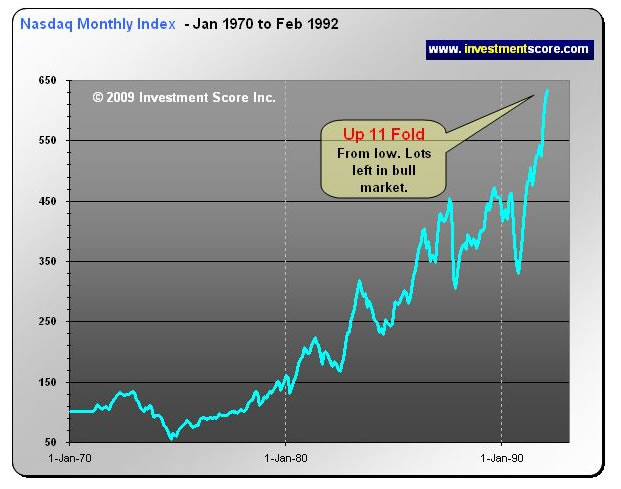
This chart helps illustrate what the massive 11 fold run up would have looked like in 1992. From this perspective it may have been reasonable to expect a bubble and exit all positions. However, our first chart illustrates that the Nasdaq later powered higher to a remarkable 82 fold climb from its 1992 high.
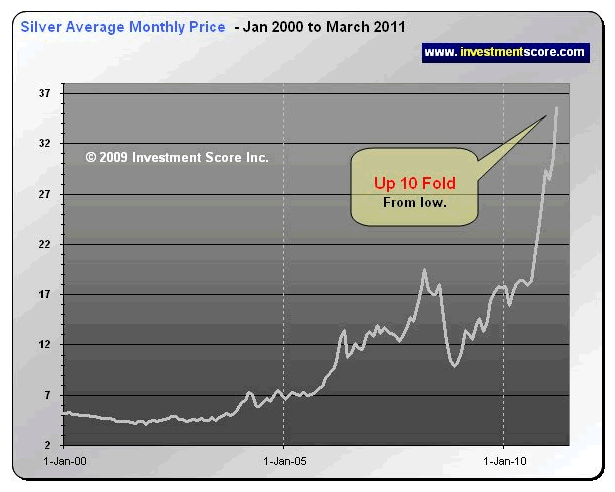
This is a current chart of silver which illustrates the remarkable parabolic spike we are witnessing today. There are many similarities between this spike and the Nasdaq mid bull market spike. From today’s perspective one may wonder how the price of silver could possible go any higher. However, as the Nasdaq chart illustrated above, it is possible for a market to head much higher and reach extreme bubble status.
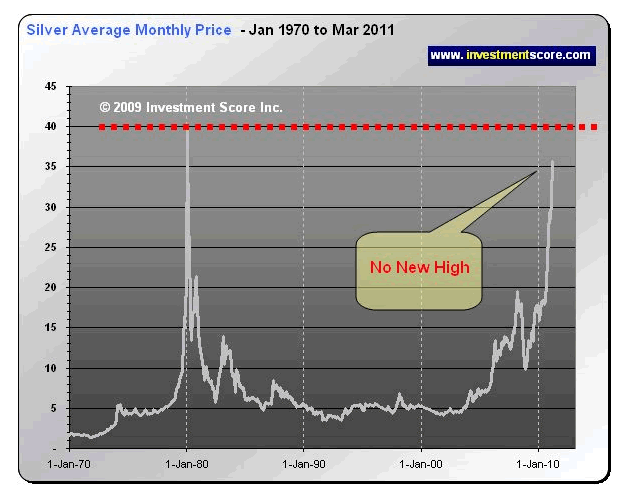
In the above chart you will notice that Silver has not hit a new all time high. The Nasdaq bubble popped with an extreme all time high that dwarfed any pervious tops. You will notice that in the 1970 – 1980 bull market run, silver’s 1980 top towers over any previous highs. There are many other signs that the silver market is not currently in a bubble such as the dismal underperformance of the silver mining shares.
All of these charts and explanations are very exciting for the potential of the Silver bull market. We believe that silver is destined to hit much higher numbers in the future, but there is another reality of this chart that we would like to point out.
When we look at the how Silver advances in the chart above, we notice that it tends to spike up and quickly fall back down. Additionally, we know that precious metals in a bull market have the potential to have extreme down turns such as the fifty percent multi-year correction in the 1970’s gold bull. A look back to 2008 reminds us of the massive volatility in these markets. The reality is that silver is spiking and history would suggest that this can be a very high risk period to put new capital to work in these markets. It is entirely possible that a significant intermediate term correction lies ahead of silver and prior to the final mega blow off that we believe is coming. We don’t think silver is currently in a bubble but that does not mean it can’t wipe out a significant number of over confident bulls who are throwing fresh new capital into this spike. Silver has climbed from $9 to $38 in only a few years and that pace is not going to last indefinitely.
At investmentscore.com we look at investments relative to various markets in order to gain a unique perspective to their “Value” instead of their “Price”. We believe it is a common mistake for investors to be misguided by “price movement” instead of by true value. At the end of the day understanding “Value” is where wealth can be created and stored as “Price” can be greatly distorted by the constant fluctuations of currencies. To learn more about our strategies and to sign up for our free newsletter please visit us at www.investmentscore.com.
By Michael Kilback
Investmentscore.com
Investmentscore.com is the home of the Investment Scoring & Timing Newsletter. Through our custom built, Scoring and Timing Charts , we offer a one of a kind perspective on the markets.
Our newsletter service was founded on revolutionary insight yet simple principles. Our contrarian views help us remain focused on locating undervalued assets based on major macro market moves. Instead of comparing a single market to a continuously moving currency, we directly compare multiple major markets to one another. We expect this direct market to market comparison will help us locate the beginning and end of major bull markets and thereby capitalize on the largest, most profitable trades. We pride ourselves on cutting through the "noise" of popular opinion, media hype, investing myths, standard over used analysis tools and other distractions and try to offer a unique, clear perspective for investing.
Disclaimer: No content provided as part of the Investment Score Inc. information constitutes a recommendation that any particular security, portfolio of securities, transaction or investment strategy is suitable for any specific person. None of the information providers, including the staff of Investment Score Inc. or their affiliates will advise you personally concerning the nature, potential, value or suitability or any particular security, portfolio of securities, transaction, investment strategy or other matter. Investment Score Inc. its officers, directors, employees, affiliates, suppliers, advertisers and agents may or may not own precious metals investments at any given time. To the extent any of the content published as part of the Investment Score Inc. information may be deemed to be investment advice, such information is impersonal and not tailored to the investment needs of any specific person. Investment Score Inc. does not claim any of the information provided is complete, absolute and/or exact. Investment Score Inc. its officers, directors, employees, affiliates, suppliers, advertisers and agents are not qualified investment advisers. It is recommended investors conduct their own due diligence on any investment including seeking professional advice from a certified investment adviser before entering into any transaction. The performance data is supplied by sources believed to be reliable, that the calculations herein are made using such data, and that such calculations are not guaranteed by these sources, the information providers, or any other person or entity, and may not be complete. From time to time, reference may be made in our information materials to prior articles and opinions we have provided. These references may be selective, may reference only a portion of an article or recommendation, and are likely not to be current. As markets change continuously, previously provided information and data may not be current and should not be relied upon.
Investmentscore.com Archive |
© 2005-2022 http://www.MarketOracle.co.uk - The Market Oracle is a FREE Daily Financial Markets Analysis & Forecasting online publication.