


Stock Market Correction May be Over
Stock-Markets / Stock Markets 2011 Mar 26, 2011 - 09:52 AM GMTBy: Tony_Caldaro

 Markets worldwide just had their best week since the beginning of November 2010. The SPX/DOW gained 2.9%, and the NDX/NAZ was +4.2%. Asian markets gained 3.5%, European markets were +4.0%, the Commodity equity group gained 2.4%, and the DJ World index was +3.2%. US economic reports, for the first time in months, were mostly on the negative side. Existing/new home sales declined, along with, FHFA housing prices, durable goods orders, public sentiment, and the WLEI. On the positive side, Q4 GDP rose along with the monetary base, and weekly jobless claims declined. Next week will be highlighted by Case-Shiller, the Chicago PMI and the monthly Payrolls report.
LONG TERM: bull market
The bull market of March 2009 is about to officially enter its third year on friday and there are still some calling it a bear market rally. From an OEW perspective, there has not been one bear market rally lasting more than two years during the entire 125 year documented history of the US stock market.
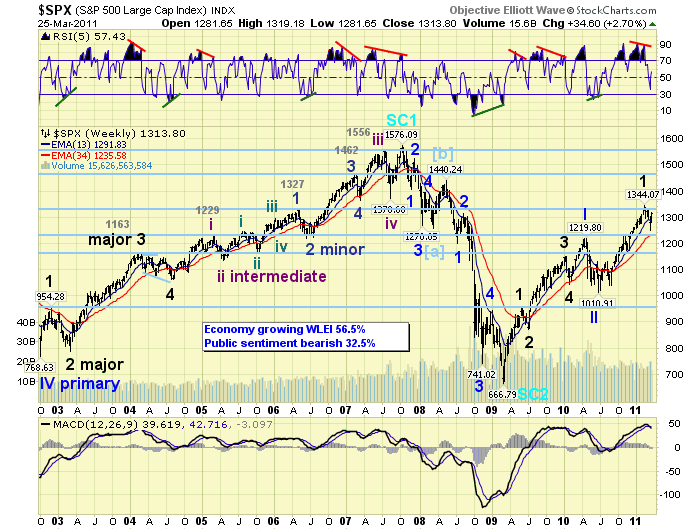
Our weekly SPX chart continues to display the bull market characteristics we have discussed from time to time. The MACD remaining above neutral during bull markets and below neutral during bear. The RSI getting extremely overbought and barely oversold during bull markets, and exactly the opposite during bear. The price action thus far is quite typical as well. Strong rallies followed by minor corrections, and then a larger correction after five waves.
Notice the five Major wave advance from SPX 667 to 1220 to complete Primary wave I in Apr10. Then the Primary wave II correction to SPX 1011 by July10. Next the Major wave 1 uptrend into Feb11 at SPX 1344. And, recently the Major wave 2 correction which may have bottomed this month at SPX 1249. Notice the Major wave corrections have been short and swift: M2/PI – 87 points one month, M4/PI – 105 points one month, M2/PIII – 95 points one month. When we do get an OEW uptrend confirmation, completing Major wave 2 and confirming that Major wave 3 is underway. We’ll be expecting the uptrend to last about three months with an upside target between SPX 1440 and 1460.
MEDIUM TERM: downtrend likely bottomed
When the SPX topped in Feb11 at SPX 1344 and then dropped 50 points to 1294 in a few days we anticipated that Major wave 1 had completed, and the Major wave 2 downtrend was then underway. The market spent the next couple of weeks rallying back to SPX 1332 and inviting a multitude of alternate counts. Eventually the downtrend took hold and OEW confirmed Major wave 2 was indeed underway.
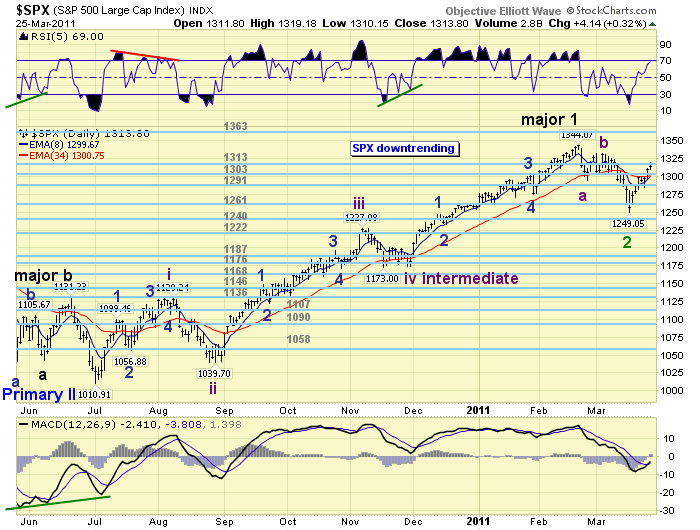
We expected the downtrend to last about one month and correct about 9% to SPX 1222. Thus far, the timeframe was correct but the correction appears to be only 7.1% to SPX 1249. At that low, we noted the market had become sufficiently oversold on all timeframes up to and including the weekly. Then this monday the market gapped up and completed its best rally since the downtrend began: 52 points vs 38 points. When the market pulled back on tuesday/wednesday, and still held the 1291 pivot range, it looked as though the bottom was in for the downtrend and a new uptrend was underway. The market then rallied even higher, to SPX 1319, to end the week. No uptrend confirmation yet, but this market is certainly impulsing higher.
SHORT TERM
Support for the SPX is back to 1313 and then 1303, with resistance at 1363 and then 1372. This is exactly where the support/resistance pivots were when the Major wave 1 uptrend topped. Short term momentum hit extremely overbought on friday before declining to around neutral to end the week. This market has climbed the OEW pivots one at a time since the SPX 1249 low. We labeled the rally from SPX 1249 to 1301 as Minor wave 1 of Intermediate wave one. Then the pullback to SPX 1284 as Minor 2. Minor 3 has been underway since then. There is some short term overhead resistance at SPX 1332 and then 1344, prior to the 1363 pivot. We’re likely to see an Intermediate wave one top around one of these levels. Support is at 1313, 1303 and then the 1291 pivot range. SPX 1284 appears to be an important support level for the potential uptrend scenario. Best to your trading!
FOREIGN MARKETS
Asian markets were all higher on the week for a net gain of 3.5%. Currently India’s BSE and China’s SSEC are in confirmed uptrends.
European markets were all higher on the week as well for a net gain of 4.0%. None of these five indices have confirmed an uptrend yet.
The Commodity equity group were all higher and gained 2.4% on the week. Both Brazil’s BVSP and Russia’s RTSI remain in uptrends.
The DJ World index gained 3.2% this week.
COMMODITIES
Bonds had quite a slide this week losing 2.3%. 10 YR yields did not rise as dramatically as the Bond price decline would suggest: 3.28% to 3.44%, suggesting it was auction related.
Crude remains in an uptrend and gained 3.3% on the week. After pulling back to $97 a week ago Crude made it back to $107 thursday before ending the week at $105. We’re still expecting a $111 target during this uptrend. And, we have just posted a $175 long term bull market target.
Gold continues its uptrend, making new highs and gaining 0.8% on the week. Uptrending Silver (+5.8%) continues to lead the precious metals sector.
The downtrending USD gained 0.6% on the week, as profit taking hit the EUR (-0.7%) and Central Bank intervention impacted the JPY (-0.9%).
NEXT WEEK
Busy week ahead economically. On monday Personal income/spending at 8:30, along with PCE prices. Then at 10:00 Pending home sales. On tuesday, Case-Shiller at 9:00 then Consumer Confidence at 10:00. Wednesday we have the ADP index at 8:15. Then on thursday, weekly Jobless claims at 8:30, Chicago PMI at 9:45, and Factory orders at 10:00. Friday is the monthly Payrolls data at 8:30, ISM services and Construction spending at 10:00. Then monthly Auto sales in the afternoon. The only things currently scheduled for the FED is a speech from FED governor Tarullo on thursday, and then the Foreign exchange rates on friday. Best to your week!
CHARTS: http://stockcharts.com/...
http://caldaroew.spaces.live.com
After about 40 years of investing in the markets one learns that the markets are constantly changing, not only in price, but in what drives the markets. In the 1960s, the Nifty Fifty were the leaders of the stock market. In the 1970s, stock selection using Technical Analysis was important, as the market stayed with a trading range for the entire decade. In the 1980s, the market finally broke out of it doldrums, as the DOW broke through 1100 in 1982, and launched the greatest bull market on record.
Sharing is an important aspect of a life. Over 100 people have joined our group, from all walks of life, covering twenty three countries across the globe. It's been the most fun I have ever had in the market. Sharing uncommon knowledge, with investors. In hope of aiding them in finding their financial independence.
Copyright © 2011 Tony Caldaro - All Rights Reserved Disclaimer: The above is a matter of opinion provided for general information purposes only and is not intended as investment advice. Information and analysis above are derived from sources and utilising methods believed to be reliable, but we cannot accept responsibility for any losses you may incur as a result of this analysis. Individuals should consult with their personal financial advisors.
© 2005-2022 http://www.MarketOracle.co.uk - The Market Oracle is a FREE Daily Financial Markets Analysis & Forecasting online publication.