Gold and Silver Are At the Threshold of Another Bullish Rally
Commodities / Gold and Silver 2011 Mar 21, 2011 - 01:21 PM GMTBy: Peter_Degraaf
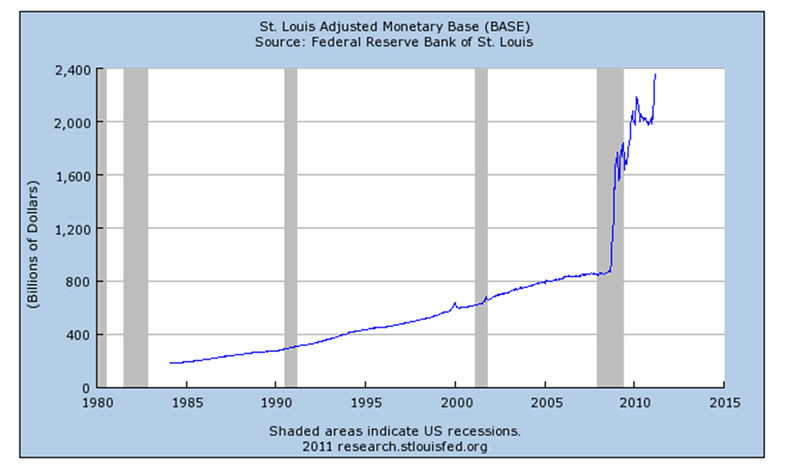
 This chart courtesy Federal Reserve Bank of St. Louis, shows the Monetary Base is rising exponentially. The current total is 2.35 trillion dollars. The increase since Jan 1/11 is 15.7%. The annualized increase is almost 65%! This increase is providing fuel for gold and silver to rise! The bankers of the world are concerned about social unrest and unemployment. They will continue to inflate (in the mistaken belief that this will solve the social problems), while pushing the effect (hyperinflation) as far into the future as possible.
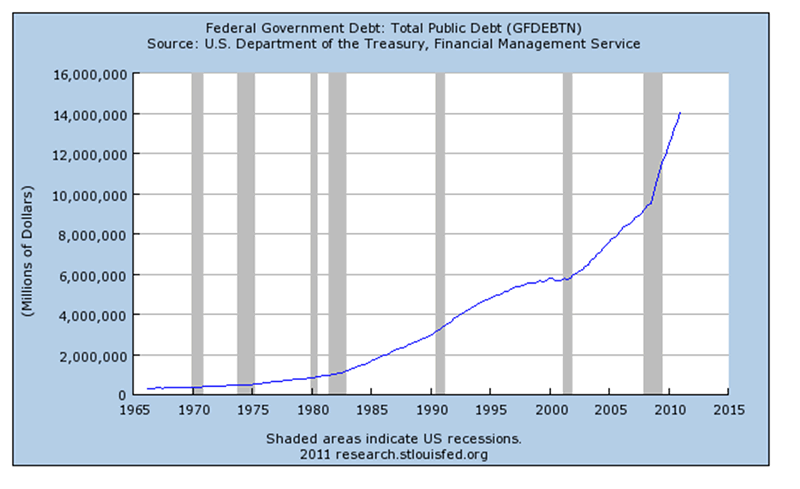
This chart, also courtesy Federal Reserve Bank of St. Louis shows US government debt is also growing exponentially. Eventually this causes the protectors against monetary inflation (Platinum, Gold, Palladium, Silver etc.) to rise exponentially as well.
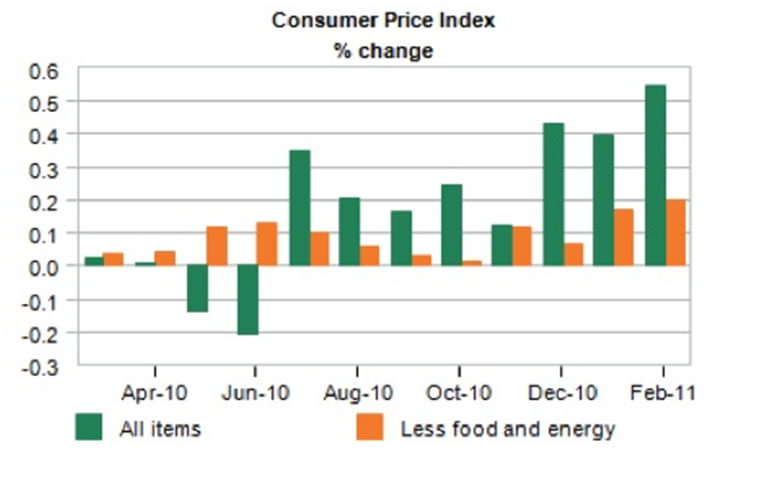
This chart courtesy Economy.com shows the US CPI is beginning to show the effects of Mr. Obama’s spending and the Fed’s money printing. The government likes to strip away food and energy from this index and that’s great if you don’t eat, nor heat your home. During the late 1970’s when the CPI began to rise like this, people started to become interested in protecting their net worth by buying gold and silver. They will do the same thing this time.
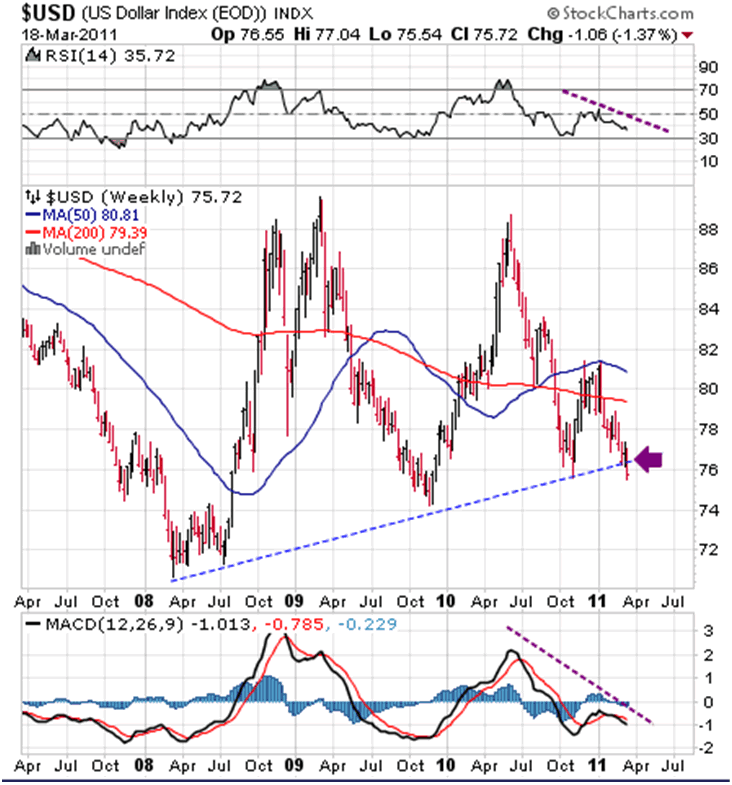
Featured is the weekly US dollar index chart. Price has just closed below the 3 year old uptrend line. Unless the dollar price can get back above the purple arrow during this coming week, a quick descent to the 71 target is likely to occur. See next chart for more information on the US dollar index.
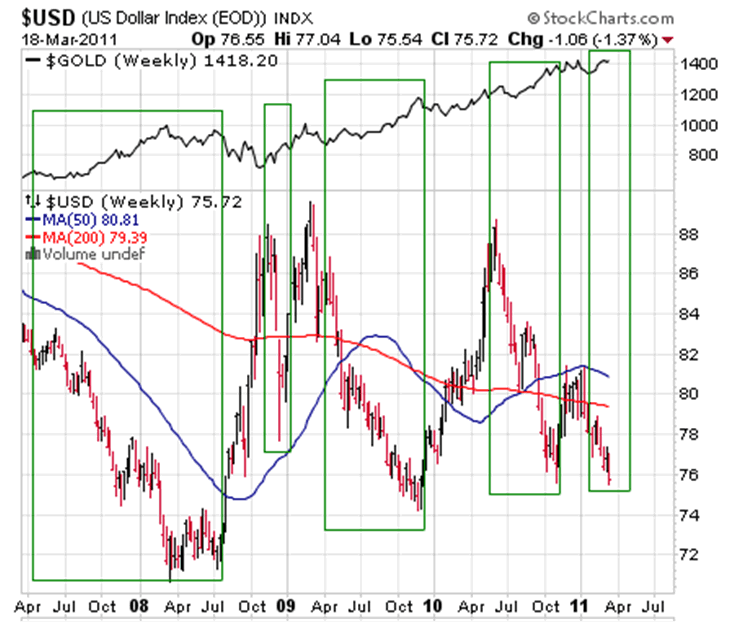
Featured is the comparison chart between the US dollar index (bottom of the chart) and the gold price (black line at the top of the chart). By isolating those periods during the past four years whenever the dollar fell, and comparing those periods to the performance of gold bullion, we arrive at the conclusion that if the dollar follows through on Friday’s drop, it will provide fuel for gold to continue its rise.
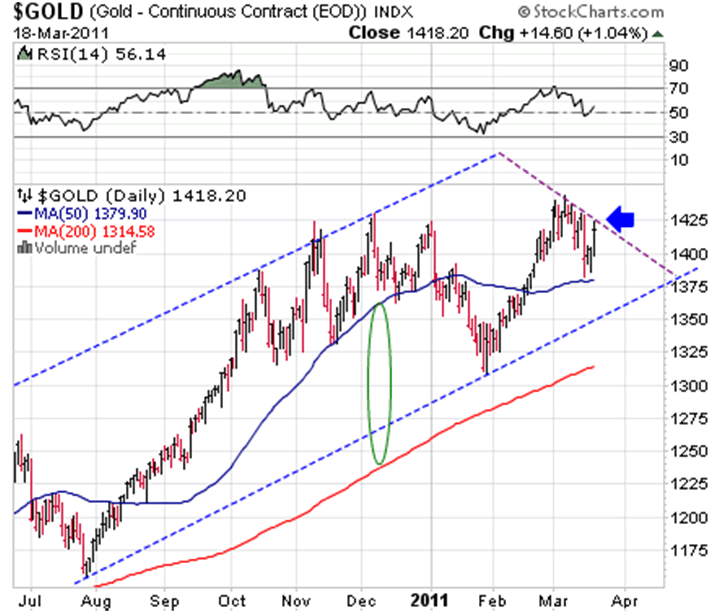
Featured is the daily gold chart. The uptrend is well defined within the blue channel. Price found support at the rising 50DMA and a breakout at the blue arrow will mark the beginning of the next rally. The RSI at top of the chart is turning up from the ‘50’ level with room to rise. The 50DMA is in positive alignment to the 200DMA (green oval), while both are rising. This is bullish action.
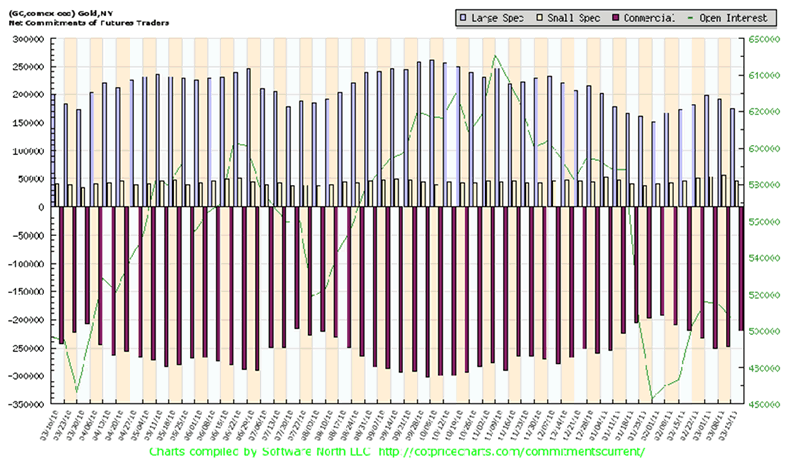
This chart courtesy Cotpricecharts.com shows the number of ‘net short’ positions in gold contracts to have been reduced from 247,000 last week to 220,000 this past week. This is bullish news as it indicates that the commercial traders think the gold price will rise. This is the sharpest one week drop in the ‘net short’ total in several months.
From 1834 to 1934 the USA was on a gold standard. The economy was able to make huge advances. Consumer prices fell, except during brief periods of war. Gold held steady during this period.
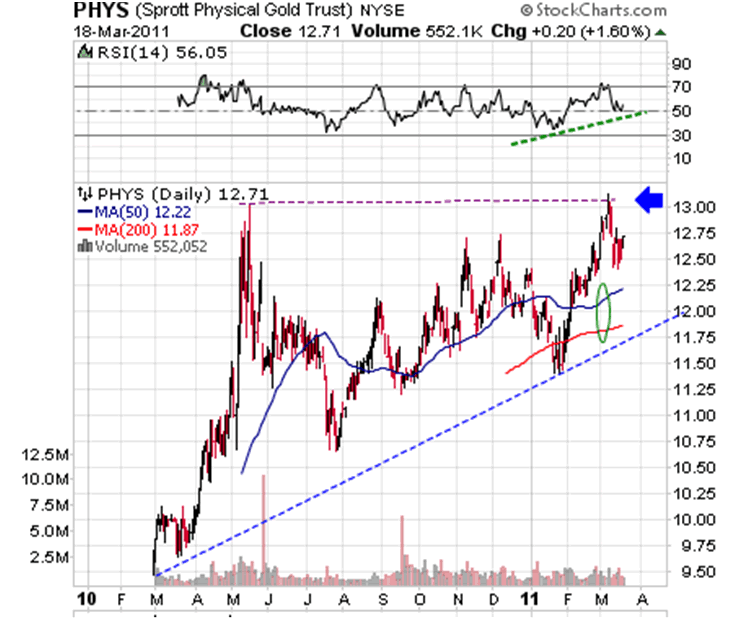
Featured is the daily bar chart for the Sprott Gold Trust. Price is carving out a bullish Advancing Right Angled Triangle (ARAT). The RSI is finding support at the ‘50’ level and the 50DMA is in positive alignment to the 200D (green oval), while both are in uptrend. A breakout at the blue arrow has a target at 16.00.
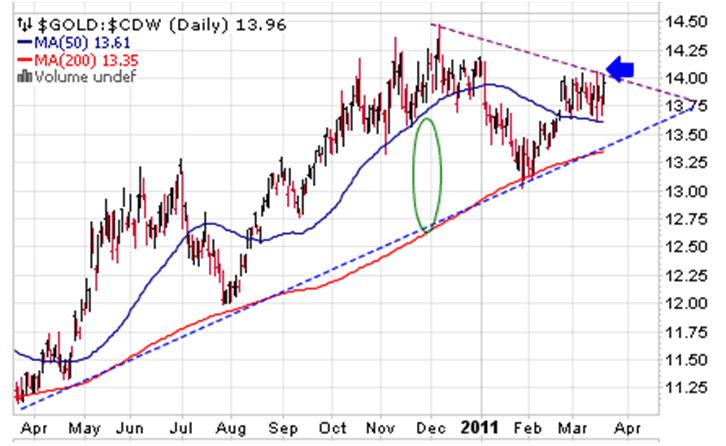
Featured is the gold price in Canadian dollars. Price is carving out a bullish pennant. A breakout at the blue arrow sets up a challenge to the previous top at 14.50.
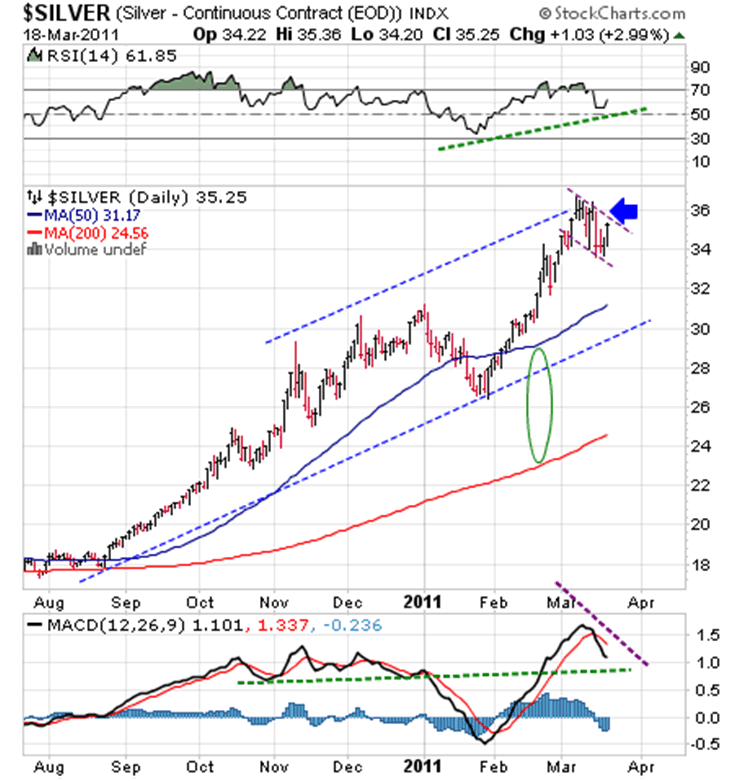
Featured is the daily silver chart. For several days in the daily report I’ve drawn attention to the fact that silver is carving out a bullish flag pattern. A breakout at the blue arrow has a target at 45.00. The RSI is ready to turn up from ‘55’ and the MACD is approaching an area of support. The 50DMA is in positive alignment to the 200DMA and both have been rising since September.
Summary: Gold and silver are at the threshold of another bullish rally within the overall uptrend. Feel free to check back on some of my previous articles found in the archives.
Happy trading!
By Peter Degraaf
Peter Degraaf is an on-line stock trader with over 50 years of investing experience. He issues a weekend report on the markets for his many subscribers. For a sample issue send him an E-mail at itiswell@cogeco.net , or visit his website at www.pdegraaf.com where you will find many long-term charts, as well as an interesting collection of Worthwhile Quotes that make for fascinating reading.
© 2011 Copyright Peter Degraaf - All Rights Reserved
DISCLAIMER: Please do your own due diligence. I am NOT responsible for your trading decisions.
Peter Degraaf Archive |
© 2005-2022 http://www.MarketOracle.co.uk - The Market Oracle is a FREE Daily Financial Markets Analysis & Forecasting online publication.


