


How to Gauge the Stock Market So you Don’t Buy to Early!
Stock-Markets / Stock Markets 2011 Mar 17, 2011 - 05:08 AM GMTBy: Chris_Vermeulen

 Over the years I have found an indicator/trading tool which I find help spot intermediate trend reversals. I am going to quickly cover in this report. As most of you know the 20 simple moving average is a great gauge for telling you if you should be looking to buy the dips or sell the bounces. It’s an indicator I keep on the broad market charts like the SP500, Dow and NASDAQ.
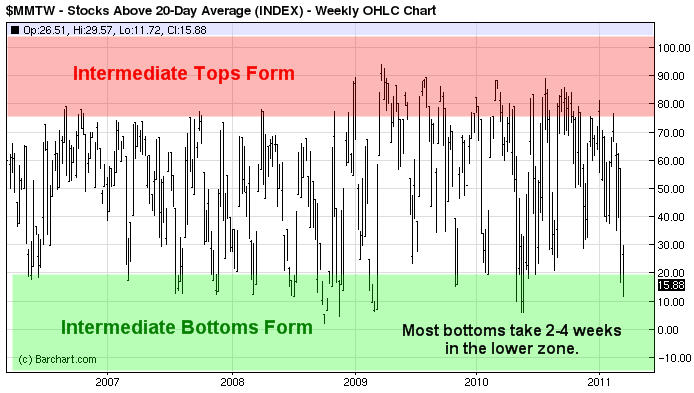
The chart below shows the percentage of stocks trading above the 20 moving average. When this indicator falls below 20%, I make sure I start to protect my short positions with more aggressive protective stops and keep an eye on short term sentiment, volume ratios, options and price action as a bottom can take place at any time and very quickly. Bottoms tend to be more of an event happening quickly with a washout/panic selling day followed by a sharp rally, while intermediate market tops drag out taking weeks if not months to roll over and are very difficult to trade which is what we have been experiencing so far this year.
As you can see this indicator is currently trading in the lower reversal zone and I feel a bottom will form before March is over.
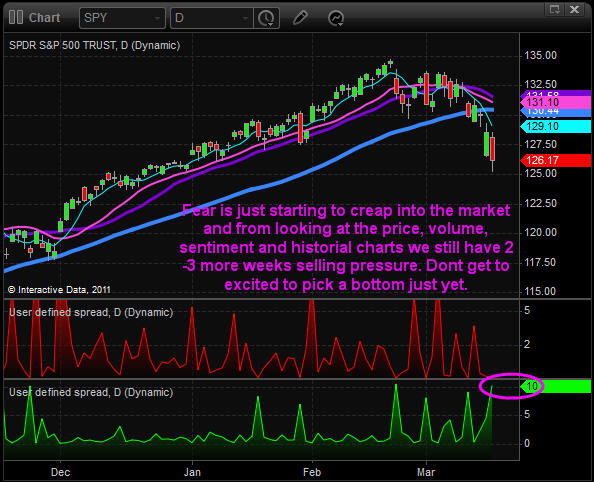
SP500 Daily Chart
The SP500 continued lower today, which is what I mentioned, would most likely take place in my pre-market video this morning. The trading session was a roller coaster with news on Japans reactors causing large waves of buy and selling throughout the day. I have not seen traders follow the news so close like this in some time… Everyone has their fingers hovering over the buy and sell button these days.
Looking at the bottom indicator which is my gauge of panic selling within the market, it has yet to close above 15 which is the minimum number I typically look for before I start zooming into the intraday charts for a long entry (market bottom). We still could see much lower prices before we see that.
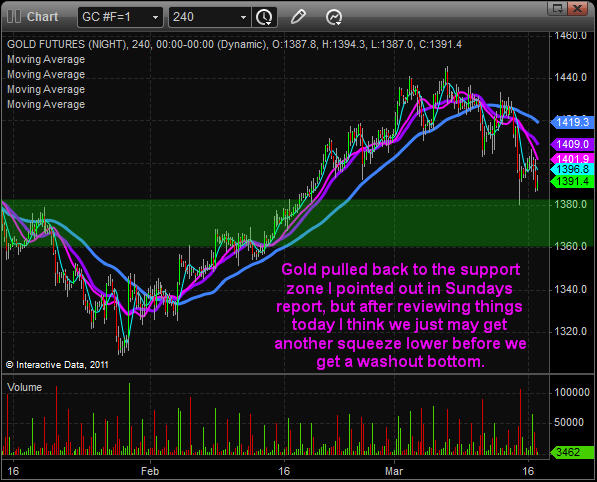
Gold 4 Hour Chart
This chart is the same one I showed in my Sunday night report, which explained why gold should test the $1380-90 level in the coming days. We did see that unfold this week but now the chart is pointing to possibly even lower prices with a support range between $1360 -1380 taking place this week. Keep an eye on it as it should be swift if it does occur.
Mid-Week Trend Report:
In short, we are finally getting the correction everyone has been waiting for and now that it’s started and we are short, we must start watching closely for a bottom because they can take place very quickly.
My focus is still on playing the short side but I have my antennas up just in case signs of a bottom start showing up.
If you would like to get more of my daily analysis to join my newsletter at www.GoldAndOilGuy.com
By Chris Vermeulen
Chris@TheGoldAndOilGuy.com
Please visit my website for more information. http://www.TheGoldAndOilGuy.com
Chris Vermeulen is Founder of the popular trading site TheGoldAndOilGuy.com. There he shares his highly successful, low-risk trading method. For 6 years Chris has been a leader in teaching others to skillfully trade in gold, oil, and silver in both bull and bear markets. Subscribers to his service depend on Chris' uniquely consistent investment opportunities that carry exceptionally low risk and high return.
This article is intended solely for information purposes. The opinions are those of the author only. Please conduct further research and consult your financial advisor before making any investment/trading decision. No responsibility can be accepted for losses that may result as a consequence of trading on the basis of this analysis.
© 2005-2022 http://www.MarketOracle.co.uk - The Market Oracle is a FREE Daily Financial Markets Analysis & Forecasting online publication.