


U.S. Households Net Worth Advances, Outstanding Debt Declines
Economics / US Economy Mar 11, 2011 - 03:04 AM GMTBy: Asha_Bangalore

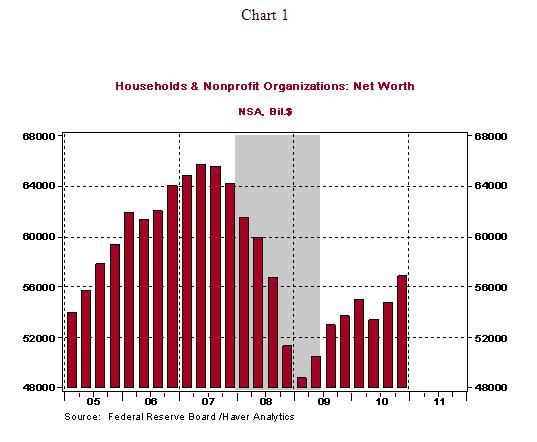
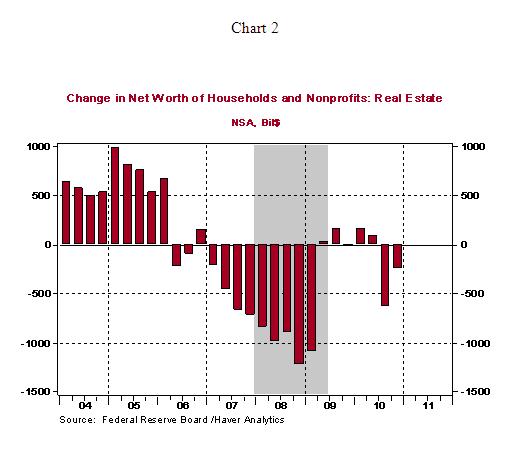
 Household net worth rose to $56.82 trillion in the fourth quarter of 2010, a 3.9% increase from the third quarter (or $2.1 trillion increase). Net worth of household has risen 16.6% from the first quarter of 2009 (the recent low, see Chart 1). Households lost 26% of their net worth between the second quarter of 2007 and first quarter of 2009, the largest loss in the post-war period. In the fourth quarter, households experienced gains in equity holdings that more than offset the loss from real estate.
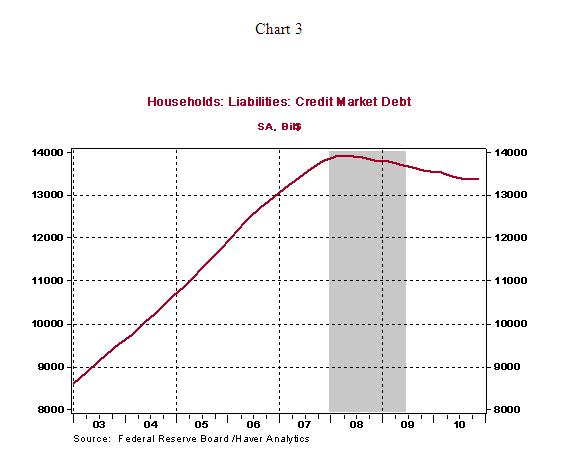
Total debt outstanding of households has declined to $13.357 trillion in the fourth quarter from a peak of $13.9 trillion in the first quarter of 2008.
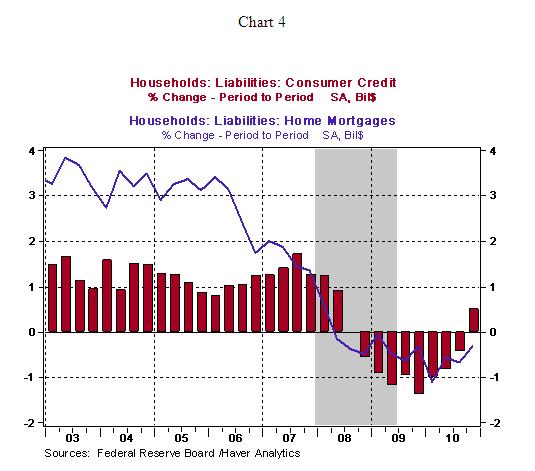
Of the major components of debt, home mortgage debt fell in the fourth quarter but non-mortgage borrowing increased after a hiatus of two years (see Chart 4).
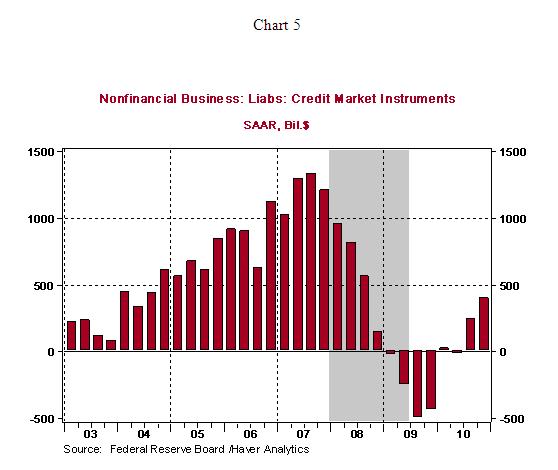
Business sector borrowing advanced in the fourth quarter (see Chart 5), indicative of a change in how firms' view the future.
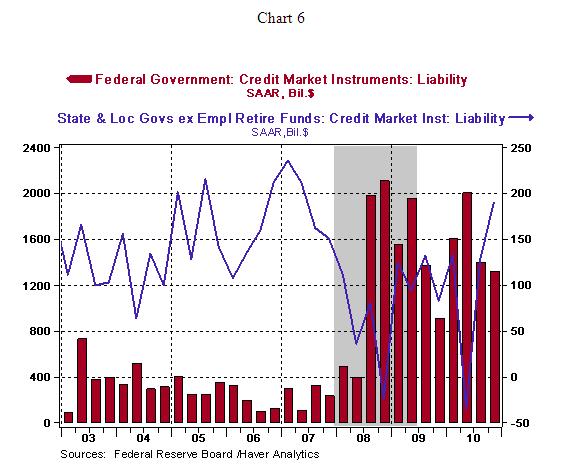
Federal government borrowing has slowed, while that of state and local governments increased sharply in the fourth quarter (see Chart 6).
Asha Bangalore — Senior Vice President and Economist
http://www.northerntrust.com
Asha Bangalore is Vice President and Economist at The Northern Trust Company, Chicago. Prior to joining the bank in 1994, she was Consultant to savings and loan institutions and commercial banks at Financial & Economic Strategies Corporation, Chicago.
Copyright © 2011 Asha Bangalore
The opinions expressed herein are those of the author and do not necessarily represent the views of The Northern Trust Company. The Northern Trust Company does not warrant the accuracy or completeness of information contained herein, such information is subject to change and is not intended to influence your investment decisions.
© 2005-2022 http://www.MarketOracle.co.uk - The Market Oracle is a FREE Daily Financial Markets Analysis & Forecasting online publication.