


End Of The Secular Commodities Bull Market?
Commodities / Commodities Trading Mar 07, 2011 - 06:37 AM GMTBy: John_Hampson

 Exponential global trends in population, consumption and debt, crunching with peak resources, climate change and falling biodiversity. "Unsustainable" sums it up, and hence no shortage of analysts forecasting imminent hyperinflation, currency collapse, one-way commodity prices or total system breakdown. In short, "this time it really is different". But is it, or rather, is it yet?
On current trends we are heading for peak total energy by 2025, significant water scarcity by 2025-2030, debt to GDP levels averaging limits in major nations by 2030-2035, cross-eco system collapses by 2035-40, serious climate change disruptions by 2040-45, and human population at the Earth's carrying capacity by 2045-55.
It may be that we push out these limits through changes in global policy or, more likely, through technological paradigm shifts in the areas of nanotechnology, alternative energy, artifical intelligence, geoengineering and biotechnology. But assuming no avances in these fields (which is improbable, based on exponential technological evolution trends), note that from the above timeline we are not yet at crunch points, just further down the road. So whilst I concur with the unsustainablity, I make the case that we "have room" for another secular stocks bull and secular commodities bear lasting perhaps 15 years, in line with historical swings. Indeed, the secular stocks bull is likely to be defined by technological paradigm shifts from the areas above, which should in turn create more space, time-wise, before commodities roar again.
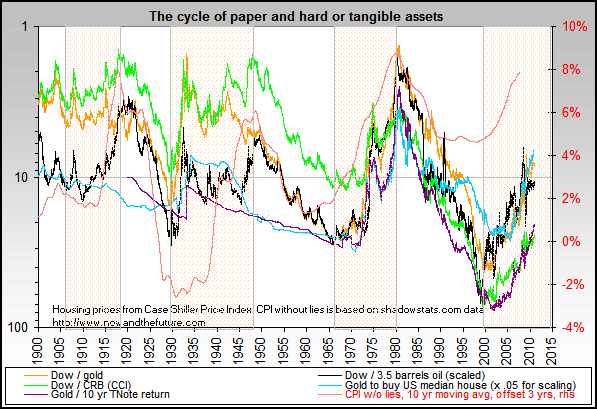
Source: nowandthefuture.com
Below I provide reasoning for why a secular inversion from hard assets to paper is likely to occur within the next 3 years, and that this final phase of the commodities secular bull should provide great returns. It is a time to hold gold, silver, oil and agri until the flags go up. But beware "commmodities to the moon" or "commodities only just getting going" calls. Dot.com, US real estate, and ALL other previous booms turned out both price-capped and time-capped, and I indentify such caps for our current commodities boom below. Timing an exit is critical, as sharp falls will follow.
--------------------------------------------------------------------------------
1. Take a look at the last two secular commodities bull markets. They share a similar chart formation to each other: a launch, a running correction, a massive leg up, a sharp retreat and a final push to a higher high (a close fit with the philosophy of 5 Elliott waves):
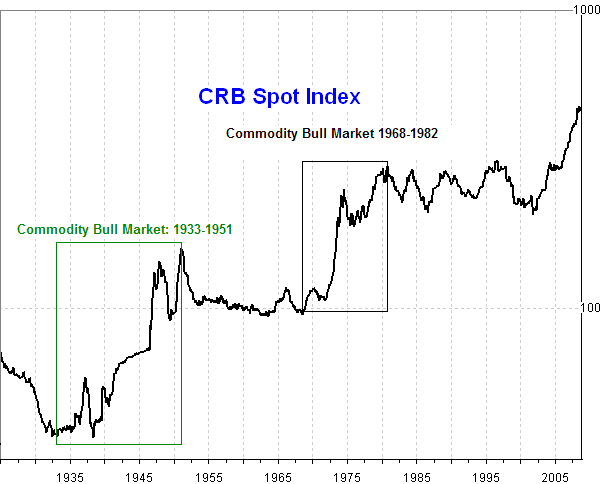
Underlying chart source: Steve Saville / Nick Laird
Our current secular commodities bull market began in 1998/2000 and looks familiar: a launch, a running correction, a massive leg up, a sharp retreat and just recently a push to a higher high. Note I am using the CCI index as it is equally weighted and equivalent to the old CRB.
Source: MRCI.com
This formation repetition suggests that we are in the final phase and should expect a secular commodities bull end between 2011 and 2014. It's important to note from the historical chart that a new secular commodities bear is likely to be overall sideways at permanently ratcheted up price levels, so don't imagine years of falling commodity prices, but rather stocks being in favour.
--------------------------------------------------------------------------------
2. Ten year rolling returns for stocks and commodities suggest that we are close to a secular inversion any time as of 2010:
Source: Barry Bannister, Stifel Nicholaus
Source: Data from Prof.Schiller via Traders Narrative
--------------------------------------------------------------------------------
3. Relative asset prices paint a picture of gold and oil now relatively expensive compared to stocks and real estate, which also adds weight to the notion of approaching a secular inversion.
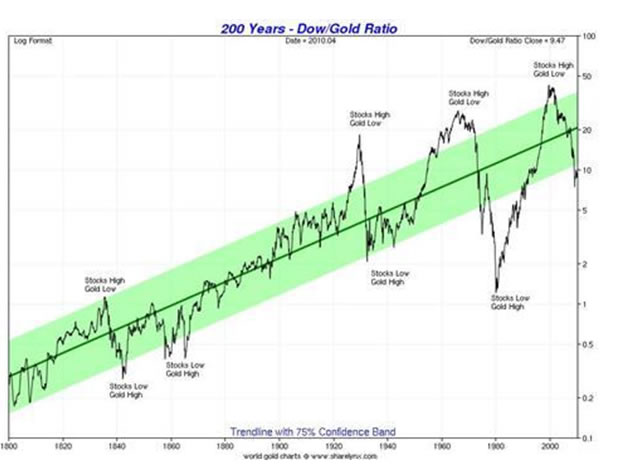
Source: Sharelynx.com
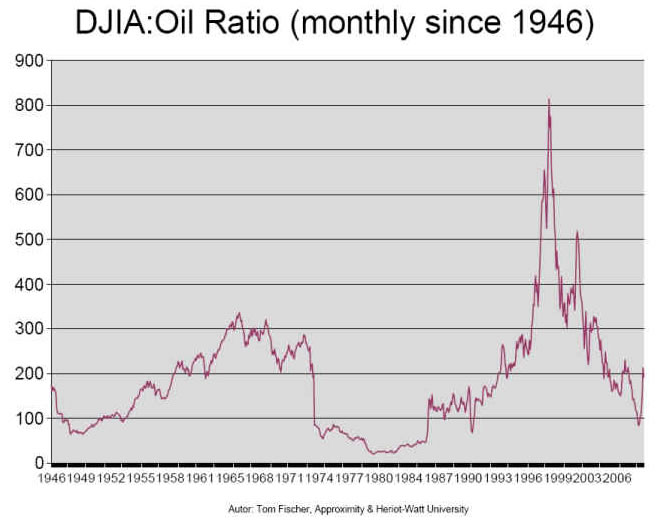
Source: Approximity
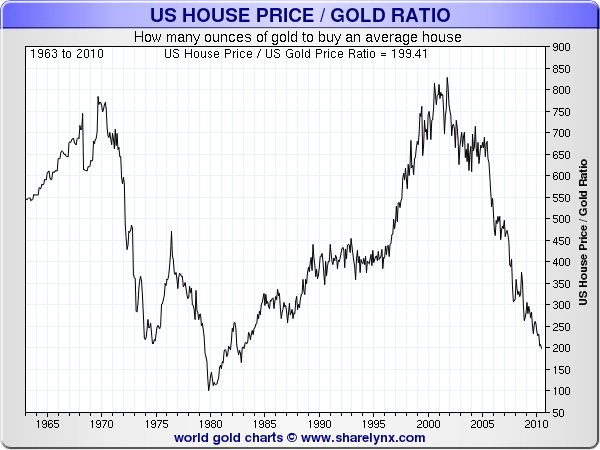
Source: Sharelynx.com
--------------------------------------------------------------------------------
4. Homing in on the the severe commodities fall of 2008, comparable commodity downlegs from history within similar cycles occured in 1921 and 1949. Following the downleg commodity prices resumed their advance and topped out in 3 years 8 months and 2 years respectively. A similar repetition would give us a secular commodities top between March 2011 and November 2012.
--------------------------------------------------------------------------------
5. Comparing durations of previous secular commodity bulls:
1906-1923 (16 years)
1933-1953 (21 years)
1968-1982 (15 years)
1998 (measured by oil) or 2000 (measured by gold) to the current day: 11-13 years so far.
A similar duration to previous bulls would give us a commodities secular bull end between 2013 and 2020.
However, comparing previous Kondratieff winter cycles (our current K season, in which gold leads assets) an extended Autumn gave rise to a shortened winter, implying our current secular gold bull should end towards to the earlier part of this window.
--------------------------------------------------------------------------------
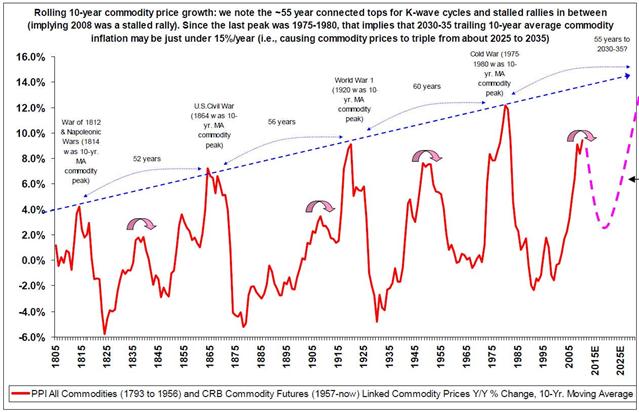
6. Looking at previous secular commodity bull price peaks:
April 1920
Jan 1951 (30 years and 9 months after the last)
Nov 1980 (29 years and 10 months after the last)
The approximate 30 year cycle between commodity price peaks which would give us a commodities price peak between September 2010 and August 2011.
--------------------------------------------------------------------------------
7. Solar cycles suggest accelerating inflation into 2013 then a recession. This would suggest an up-move in commodities into 2012/13 before either a period of remaining elevated or the secular commodities end.
--------------------------------------------------------------------------------
8. By dollar cycles, and based on the dollar's inverse relationship with commodities, a price peak or secular top in commodities is forecast for mid-2012.
Source: Moneyandmarkets.com
--------------------------------------------------------------------------------
9. Based on historical asset booms and bubbles, including gold's own last secular bull, gold would accelerate to its peak by 2012.
--------------------------------------------------------------------------------
10. Fundamentals: China's breakneck growth and industrialisation is one key driver, underinvestment in commodities supply in the 80s and 90s is another.
Historic comparisons suggests that China is likely to be derailed at some point, before growth resumes. Bubbles and structural imbalances would be common causes, and China shows such signs. Were China to derail, the fundamental story for commodities would significantly weaken.
1. China has large excess raw materials capacity - overproducing cement, steel and more.
2. China has an excess of 3.3 billion square metres of floor space - there are whole cities lying empty or near empty.
3. Property prices are at bubble levels - the average price-to-rent ratio of China's eight key cities is 39.4 times, compared to 22.8 times in America just before its housing crisis. Chinese investment in residential property accounted for 6.1% of GDP in 2010, again a similar level to that in the USA pre-crash. Japan's real estate bubble collapsed at 8% of GDP, but on another measure China is similar to Japan's peak: the value of housing stock is set to exceed 350% of GDP in 2011.
4. China's artificial currency peg to the dollar, to keep exports competitive, is creating an inflation problem.
Since commodity prices took off again in 1998/2000 new supply has gradually been initiated globally, but it typically takes around 10 years for a new mine of field to come on stream. We are now entering the window whereby additional supply is coming to fruition and will increasingly do so over the next several years, which will dampen prices.
Combining China and supply fundamentals we should be alert for a commodities bull peak as of 2011.
--------------------------------------------------------------------------------
Amalgamating all ten references, we can conclude that the secular commodities bull is most likely to peak and then invert in the window 2011-2014.
So it would appear that we are close to an end, in secular terms. But that doesn't mean we should be getting out of commodities - yet. On the contrary, the final stages of a secular bull typically produce great returns, with a parabolic ending move. The key is to hold for this move but sell before the ultimate reversal occurs. And the reversal is typically fast and severe. Following the last secular gold peak in 1980 gold dropped 43% in 2 months.
So let's turn to price targets.
--------------------------------------------------------------------------------
The above "Going Vertical" chart suggests gold needs to just more than double from 2008-9 levels to complete its secular bull, giving us a peak target for gold of around $2000.
--------------------------------------------------------------------------------
Silver is a leveraged gold play, and based on the chart below, the target peak price for silver is around $125.
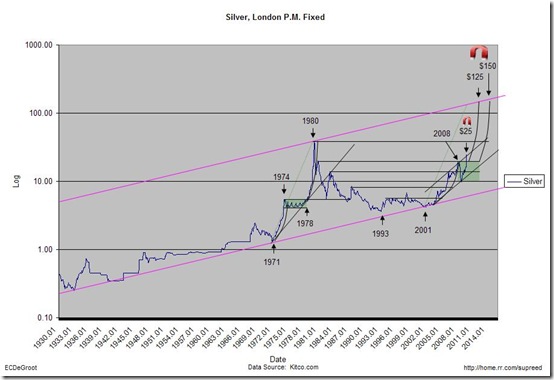
Source: ECDeGroot
--------------------------------------------------------------------------------
Crude oil has been in significant contango in the last 2 years, meaning the current contract price is significantly lower than future contract prices around 1 year further out. History shows that oil usually does not peak until this is reversed, implying that we need to see the current contract price run up some way until it exceeds contracts around 1 year out by some way. At the time of writing the current price is almost equal to that 11 months out, so we may need to see this advance to around $5 above or more.
Source: mcoscillator.com
In order to crude oil to achieve that, it needs to break through the 61 Fibonacci retracement (the last Fib) of the 2008 declines, with which it did so on Friday: around $103. Assuming that Fib break holds, it is then normal for an asset to retrace 100%, meaning we have a minimum crude oil peak price target of a double top at $150.
--------------------------------------------------------------------------------
In summary, I believe we will see a commodities price peak and then secular inversion (a new stocks secular bull and commodities secular bear) between 2011 and 2014, with price targets to hold to of around $2000 gold, $125 silver and $150 oil.
John Hampson
John Hampson, UK / Self-taught full-time trading at the global macro level / Future Studies
www.amalgamator.co.uk / Forecasting By Amalgamation / Site launch 1st Feb 2011
© 2011 Copyright John Hampson - All Rights Reserved
Disclaimer: The above is a matter of opinion provided for general information purposes only and is not intended as investment advice. Information and analysis above are derived from sources and utilising methods believed to be reliable, but we cannot accept responsibility for any losses you may incur as a result of this analysis. Individuals should consult with their personal financial advisors.
© 2005-2022 http://www.MarketOracle.co.uk - The Market Oracle is a FREE Daily Financial Markets Analysis & Forecasting online publication.