


Everything Is Now Correlated Exclusively To The Fed's Balance Sheet
Stock-Markets / Financial Markets 2011 Mar 06, 2011 - 12:37 PM GMT

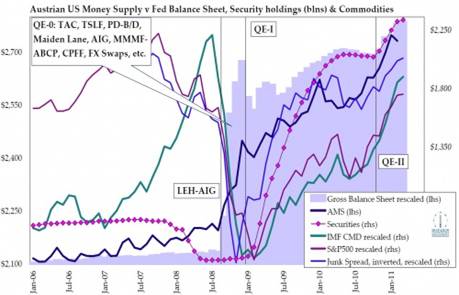
 (ZeroHedge) The chart which we presented a few weeks ago courtesy of Sean Corrigan sees a few additional components added to it. Whereas before the chart focused on the Adjusted Austrian money supply and commodity prices, it now sees the addition of the S&P and Junk spreads. In a word: every single asset class correlates 1:1 with the Fed's balance sheet. If the Fed is really planning on ending QE2 on June 30, the market collapse will be epic. And, yes, this should not come as a surprise to anyone.
VIX came back for a second retest of the Wedge Trendline.
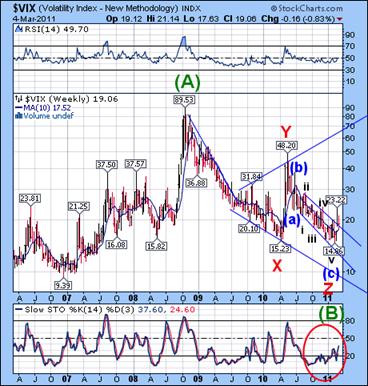 -- VIX traded in and now range this week, closing again at its wedge trendline. This may still be considered bullish for the VIX. The first reason is that it has not violated the trendline that it gapped through last week. The second reason is the gap left on February 22 is still open, which is a trait of a third wave or wave C. What is fascinating about this is that Bloomberg reports on VIX's fall this week rather than the huge rally and had the week before.
I wish to remind you that the following broadening wedge is a bullish formation. Rallies out of the falling wedge can be quite substantial.
SPX tested 10-week Support.
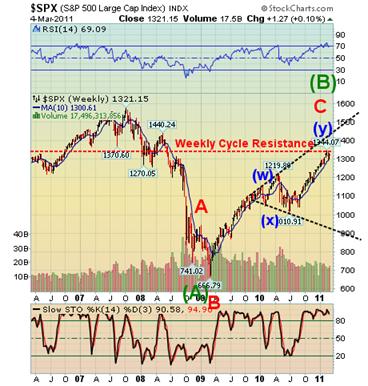 SPX has found support at 10-week moving average this week. Not seen on the chart are two gaps, one bullish and one bearish. The first gap was left on February 22 when it gapped down from 1343.01 to 1338.91. Filling that gap implies a bullish continuation (not favored). The second gap occurred on March 3 when the SPX gapped up from 1308.44 to 1312.37. Filling that gap would be very bearish. The Elliott Wave structure implies a decline or even a gap down this Monday.
Most traders are blissfully unaware of the potential for a decline, or possibly a gap through the 50 day (10 week) moving average on Monday.
The NDX closed between gaps.
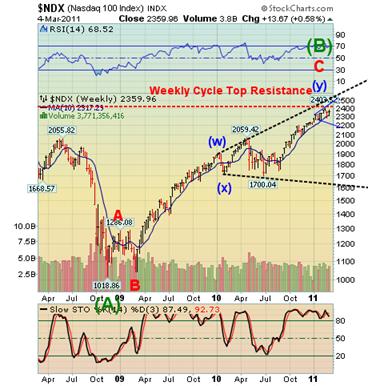 --The NDX was also unable to fill its gap between 2353.81 and 2392.47 on February 22. The inability to fill the higher gap is quite bearish. Thursday's action left us another gap between 2326.77 and 2350.52, where the NDX hesitated on Friday. The pattern left at the close is a small 50% retracement. If this analysis is correct, the first item on Monday's agenda for the NDX will be to decline through the lower gap and resume the bear trend.
The smaller Broadening Top trendline is at 2200.00. Once violated, it appears to be targeting the lower trendline near 1600.00 of a larger-degree Broadening Top that dominates the 2010 pattern.
Is gold linked with political turmoil?
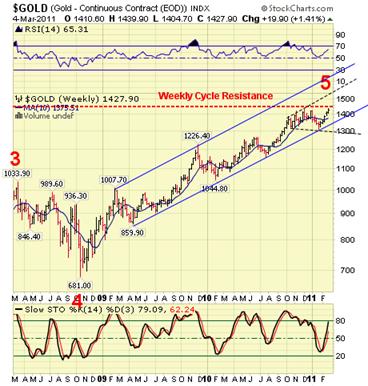 -- Gold shows a reversal pattern in the daily charts at the close on Friday. The brief new high to finish the final pattern has been accomplished. Gold fell short of its weekly Cycle Top Resistance at 1456.94. The dollar pivot was on Friday, while the gold pivot occurs next Wednesday. While gold may trade in a narrow range for the next couple of days, I would expect to see a reversal by Wednesday.
Sentiment in gold is very bullish, with most analysts calling for further rallies. You can see from the article that people are making a connection between political turmoil and the price of gold.
$WTIC closed at its Broadening Top trendline.
 -- $WTIC spiked in a panic-driven rally last week to complete a 62% retracement of its 2008 decline and touch the upper trendline of its Orthodox Broadening Top Formation. It closed above its Cycle Top Resistance at 99.75.
Although the rally is extremely extended, the big picture is that crude may have finished the largest pre-crash formation in its history.
With big economic reports and fourth-quarter earnings mostly out of the way, U.S. stock investors will continue tracking oil-price movement in the coming week.
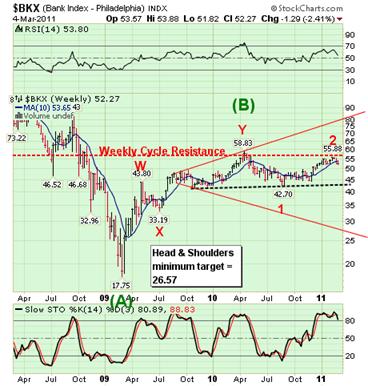
The Bank Index begins a wave three.
--The $BKX continues to lead the market down below its 10 week moving average. This is the index most susceptible to a Flash Crash.
Wall Street swindler Bernard Madoff said in a magazine interview published Sunday that new regulatory reform enacted after the recent national financial crisis is laughable and that the federal government is a Ponzi scheme.
"The whole new regulatory reform is a joke," Madoff said during a telephone interview with New York magazine in which he discussed his disdain for the financial industry and for its regulators.
The Shanghai Index remains above its 10-week moving average.
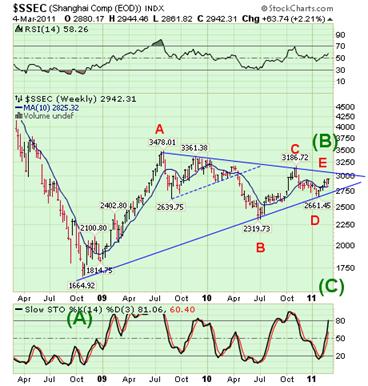 -- $SSEC continued to rally above its 10-week moving average at 2825.32. The rally from its Master Cycle low appears to be doomed to fail within the Triangle formation. Wave Es tend to be unpredictable, so I am making no assumptions when the turn may occur.
Fighting inflation is China’s top economic priority this year as the government aims to limit the risk of social unrest, Premier Wen Jiabao said in his state-of- the-nation speech. “We cannot allow price rises to affect the normal lives of low-income people,” Wen said in a report to the annual meeting of the National People’s Congress in Beijing today. “This problem concerns the people’s well-being, bears on overall interests and affects social stability.”
USB corrects between its 10 week moving average and it's wedge trendline.
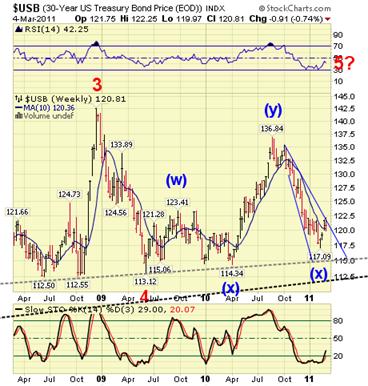 -- $USB has been doing some consolidation above its 10-week moving average, which may lead to a breakout of its descending Broadening Wedge, a continuation formation. Monday is the pivot day that may likely launch USB over the top. This may also lead to a wave of short covering. Weekly Stochastics are very bullish.
Treasuries fell, with 10-year notes halting a three-week rally, as signs of faster job growth and more inflation added to speculation the economic recovery is building momentum, damping demand for fixed-income assets.
$USD is ready for a reversal.
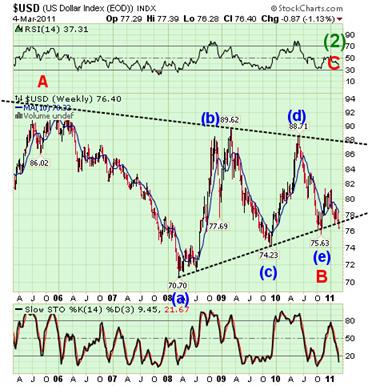 -- The November low continues to hold in $USD while it gave way in UUP this week. Either way still results in a triangle formation in both the index and the ETF. The Pivot low on Friday may have arrived just in time for a reversal on Monday. UST made its potential target of 76.26, which I had suggested last week.
Traders seem to be focused on a potential rate hike by the ECB, when in fact the European Central Bank may do no such thing, especially in the face of bad news that appears to be on the horizon. A failure of the euro will put the dollar back in the driver’s seat.
Traders alert: The Practical Investor is currently offering the daily Inner Circle Newsletter to new subscribers. Contact us at tpi@thepracticalinvestor.com for a free sample newsletter and subscription information.
Our Investment Advisor Registration is on the Web
We are in the process of updating our website at www.thepracticalinvestor.com to have more information on our services. Log on and click on Advisor Registration to get more details.
If you are a client or wish to become one, please make an appointment to discuss our investment strategies by calling Connie or Tony at (517) 699-1554, ext 10 or 11. Or e-mail us at tpi@thepracticalinvestor.com .
Anthony M. Cherniawski, President and CIO http://www.thepracticalinvestor.com
As a State Registered Investment Advisor, The Practical Investor (TPI) manages private client investment portfolios using a proprietary investment strategy created by Chief Investment Officer Tony Cherniawski. Throughout 2000-01, when many investors felt the pain of double digit market losses, TPI successfully navigated the choppy investment waters, creating a profit for our private investment clients. With a focus on preserving assets and capitalizing on opportunities, TPI clients benefited greatly from the TPI strategies, allowing them to stay on track with their life goals
Disclaimer: The content in this article is written for educational and informational purposes only. There is no offer or recommendation to buy or sell any security and no information contained here should be interpreted or construed as investment advice. Do you own due diligence as the information in this article is the opinion of Anthony M. Cherniawski and subject to change without notice.
Anthony M. Cherniawski Archive |
© 2005-2022 http://www.MarketOracle.co.uk - The Market Oracle is a FREE Daily Financial Markets Analysis & Forecasting online publication.