


Stock Market Weekly Update: How to Keep Your Profits
Stock-Markets / US Stock Markets Nov 04, 2007 - 03:02 PM GMTBy: Dominick
 This was another one of those weeks where a lot of traders who were holding profits one day, saw them vanish the next, sometimes literally overnight. If this was you, I can pretty safely say what you weren't doing – getting out of your positions while the getting was still good. At TTC we have one simple strategy for keeping our profits … it's called “take the money and run” (TMAR).
Now, I hate getting out of a trade too early as much as anyone else, don't get me wrong. That's why we don't just call a TMAR at any old place; we always use entry and exit targets for a trade, plus keep each other posted about the market's momentum in our realtime chatroom so we can stay or go as needed to maximize the actual profit we take away.
So, remember this chart from last week?
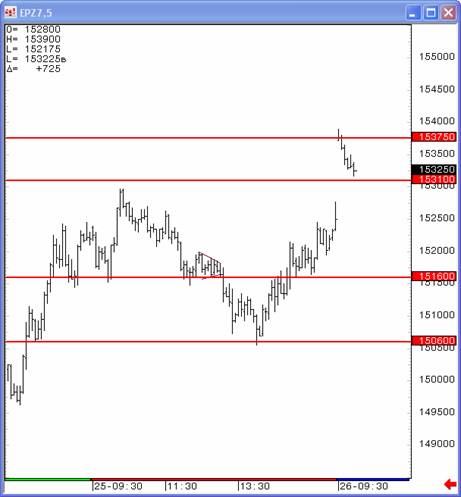
All in this one chart was the lower register of our key target numbers and a picture of how the market obviously recognizes them on a day to day basis. This was posted in the last update, so readers were actually given a fair insight to our strategy for this week, though, of course, members had a much more detailed and realtime roadmap.
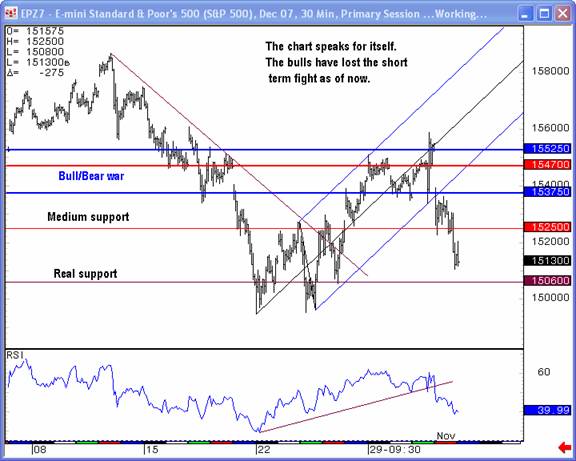
That map for members is shown in the chart below, which we essentially interpreted as a war zone between the bullish and bearish forces in the market, collared between two of our most important target numbers, 1552.50 and 1537.50 in the S&P futures. And as usual, while most of the street jockeyed for position ahead of the Fed decision, we put that in the back of our minds and simply scalped our range which, as you'll see, was quite an effective strategy.
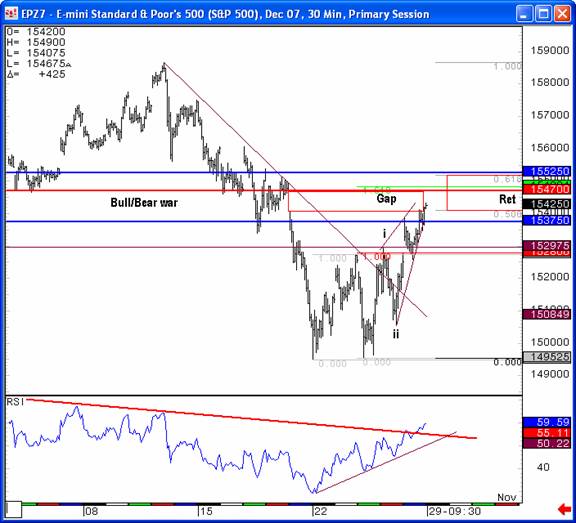
When Monday morning gapped up into our red support/resistance line at 1547, the only question was whether we'd see support there, or resistance. The market simply vibrated around this level all day, so we didn't have our answer exactly, but we did have confirmation that we were watching the right level. Whichever direction the market moved from there, that's the trade we'd take.
So, as Tuesday's market began to selloff, we shorted right along with it, that is, until the move reached back down to our old 37.50 level, the bottom blue line on the road map. With roughly ten points of profit it was time to take the money and run (TMAR) as risk/reward was no longer in our favor on the downside. A gap up on Wednesday validated that call, and a steady grind higher brought us back to choppy trade at 47.50, where we were happy to be flat ahead of the Fed decision. Again we were poised at one of our targets, indifferent to the direction of the trade, just waiting for confirmation.
Then, just minutes before the release of the statement, the market started to dip lower. A sell-the-news reaction to a quarter point cut was something lots of talking heads and pundits had contemplated, but we weren't looking for a major selloff, not when we had the chart below showing support in the RSI, at the Andrew's fork, and at 37.50 all coming together.
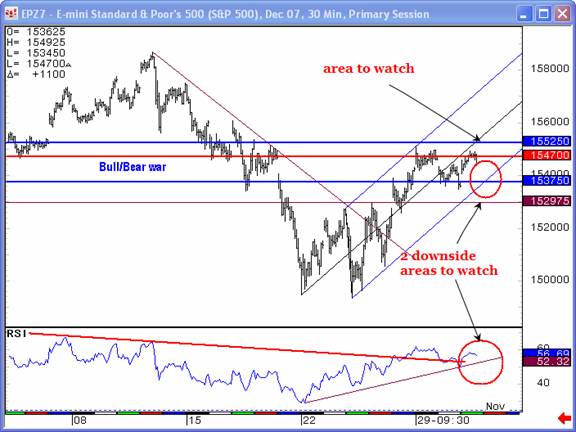
As we reached the critical level in the wake of the Fed announcement, we had the further confirmation from our proprietary trend charts that the next move was to go higher. Of course we took the long trade which certainly must have seemed like catching a falling knife to some, who, without the benefit of this chart could see no reason to be pulling the trigger on a buy.
But, as you probably know, the initial selloff as the Fed statement was released wound up reversing dramatically. Our long at 37.50 caught some 15 points of profit in a matter of minutes. As we pierced 1552.50 to the upside we were willing to ride the momentum where it would take us, but as the rally began to stall, we became increasingly skeptical. Finally, as we retested 52.50 from above and failed, the call rang out in the TTC chatroom to… well, you probably guessed it.
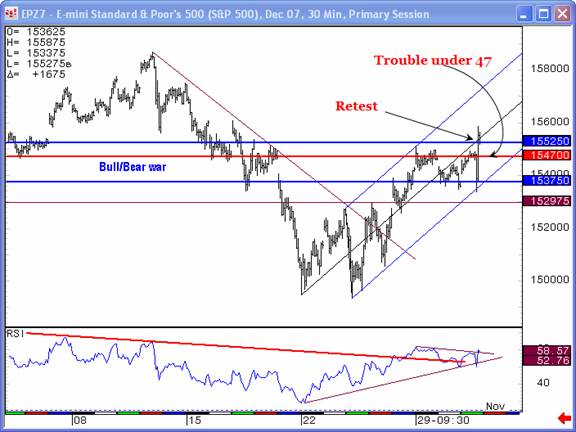
That TMAR on Wednesday afternoon was probably the call of the week as , through applying our strategy and our target levels, we were able to keep a good portion of our profit for the day. Yes, it was a bit disappointing to be flat and sleeping as the market sold off overnight, but not terribly upsetting. Besides, as we woke to a big gap down Thursday, at 37.50 no less, all we had to do was shift back to our lower range of numbers and continue playing our strategy.
Obviously, losing 37.50 was going to make us bearish, and by the time we'd lost that level in a big way, we were trading on the short side. The chart from last week had 1506, so we were already contemplating the possibility of getting that low, but probably not all at once. 1525 became a number circulated in chat and on the forum as a likely support level, and the chart below illustrates the market's reaction to that line. Rallies off of 25 failed to get back above 37.50, which took us out of a long attempt and put us back short. Ultimately, the market's momentum overshot our 1506 target, but getting long as we recovered that level gave us another 10 points into the close, and another TMAR.
For week's we've had the opinion that a year-end rally was likely, but when that became the consensus, at least among the TV pundits, it seemed to be a crowded trade. By staying nimble and unbiased, we were able to trade our charts and navigate a difficult week, keeping our profits, as news from major banking firms hit the wires and sabotaged the tape.
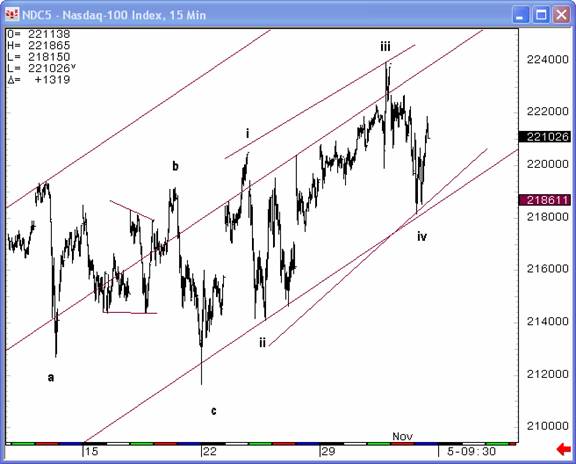
Next week could be tricky as this latest decline tries to establish some footing, but it currently appears to be a 3-wave decline – a hint at our unique interpretation which has yielded a new pattern to follow, as our older ones already seem to have been played out by the street. That chart is only available to members, but suffice it say that this week's action got a lot of bulls off the ride and if they decide to get back on soon, we could be seeing a very powerful move. If the banking sector somehow manages to get its legs under it, you can kiss those current record highs in the S&P goodbye. And, have you seen this count in the Nasdaq?
No guarantees, but this is something that we'll be watching. And now you readers have a nice head start on the end of the year. My only concern is whether you'll be able to keep your profits.
Don't forget to Join now for only $89 a month!
Have a profitable and safe week trading, and remember:
“Unbiased Elliott Wave works!”
By Dominick
www.tradingthecharts.com
If you've enjoyed this article, signup for Market Updates , our monthly newsletter, and, for more immediate analysis and market reaction, view my work and the charts exchanged between our seasoned traders in TradingtheCharts forum . Continued success has inspired expansion of the “open access to non subscribers” forums, and our Market Advisory members and I have agreed to post our work in these forums periodically. Explore services from Wall Street's best, including Jim Curry, Tim Ords, Glen Neely, Richard Rhodes, Andre Gratian, Bob Carver, Eric Hadik, Chartsedge, Elliott today, Stock Barometer, Harry Boxer, Mike Paulenoff and others. Try them all, subscribe to the ones that suit your style, and accelerate your trading profits! These forums are on the top of the homepage at Trading the Charts. Market analysts are always welcome to contribute to the Forum or newsletter. Email me @ Dominick@tradingthecharts.com if you have any interest.
This update is provided as general information and is not an investment recommendation. TTC accepts no liability whatsoever for any losses resulting from action taken based on the contents of its charts, commentaries, or price data. Securities and commodities markets involve inherent risk and not all positions are suitable for each individual. Check with your licensed financial advisor or broker prior to taking any action.
Dominick Archive |
© 2005-2022 http://www.MarketOracle.co.uk - The Market Oracle is a FREE Daily Financial Markets Analysis & Forecasting online publication.