


Timing the China Property Crash
Housing-Market / China Economy Feb 28, 2011 - 05:35 AM GMTBy: Mike_Shedlock

 Inquiring minds are investigating Analysis of the Chinese Property Bubble by Huw McKay, Senior International Economist, for Westpac Bank.
China: strong for now but imbalances loom
The strength in China’s January trade data was absolutely remarkable. Going back to 2000, the level of unadjusted exports or imports in a January month has never exceeded the level in the immediately prior December: until now. There are deep-seated seasonal reasons why this just shouldn’t happen - and history had never offered an exception to the rule. So, clearly, seasonally adjusted month-on-month growth was huge - around 12% for exports and 16% for imports. Iron ore import volumes were a monthly record by almost 7%. Sure, global manufacturing had a strong end to the year and business surveys had a respectable January, but this sort of implied demand is bordering on ridiculous. While three consecutive months of triple digit growth in imports to the special economic zones through Q4 argue the export numbers should not be a total surprise (at least on the supply side, never mind who the customers are), we remain astonished by the import surge.
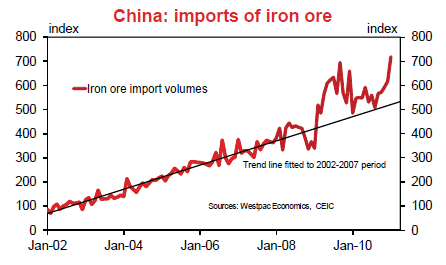
Yes, commodity prices rose and some public and private discretionary inventory building ahead of the lunar new year was likely underway, but neither factor goes all that far in explaining the level of apparent demand. Getting away from levels and getting back to growth, at 51%yr imports are as strong as they were in the first half of 2004, when the authorities saw fit to clamp down on out of control heavy industrial investment, overall fixed investment began the year up 53% and 24 of 31 provinces experienced power shortages as an overloaded grid strained under the pressure. Is that a good description of the current climate? No, not really, but to say that the economy has good momentum opening the year would be an egregious understatement.
So, the Chinese economy is expanding at a rapid pace – for now. However, the imbalances that have emerged in the policy induced recovery phase have not disappeared. In fact, they have been inflamed. When real estate policy began to be tightened in the first half of 2010, the volume of sales moved broadly sideways (with regional variation), but the volume of new starts continued to rise .
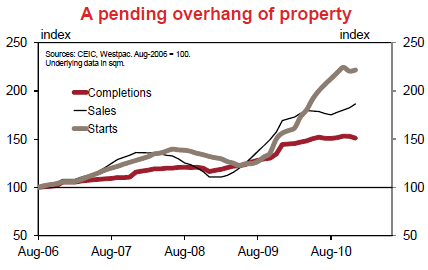
The implications of this are many. One, bringing these projects to completion will generate very significant demand for raw and intermediate materials. This should keep commodity markets well supported in coming months - even if a pull-back from extraordinary January import levels must be assumed, and the fact that base metals prices are extremely elevated already. But the stronger implication is that once these starts do reach completion it seems extremely unlikely that the level of sales will be high enough to comfortably absorb the new supply. That implies that the developer industry will run into some trouble later this year and into early 2012 – and that will impact on activity levels in the construction sector, with predictable flow-on effects for upstream industries inside China and out.
Estimating a precise lead time between starts and completions is not easy. The private construction cycle is young enough that it has yet to establish firm “rules of thumb” for forecasters to adopt. Chinese housing ownership reforms date back to just 1998 and the explosion in private sector housing activity dates to only 2003. We have a single national downturn to ponder (late 2008) in addition to the Shanghai experiment of 2004/05. While the cycle does appear to be settling into more of an established groove, we are not at a point where we can be confident about the leads and lags. Our best efforts suggest that a lead period of between 1½ and 2 years is a reasonable if imprecise guide. As the surge in starts dates back to the middle of 2009, the first “cluster” of completions should be hitting the market in physical form later this year, and in “off-theplan” form somewhat earlier. But the post-April rise in starts is a story for early-mid 2012. Where will sales demand be at this time against a backdrop of monetary tightening? Not high enough.
It should be emphasized that we are talking about new supply coming to market. Secondary stock is to be added to the amount of housing available for sale. When the volume of sales fell below completions in late 2008 (Chart 2) developers were forced to discount aggressively to offload their properties. In the absence of a supportive policy shift as part of the second stimulus package, realised prices could have fallen by 20-30%, essentially consuming the entire margin rumoured to be enjoyed by the luxury development sector. The policy response should events play out as expected is a vitally important question. On the one hand, history argues that the “Wen put” (an analogue of the legendary “Greenspan put”) will again be exercised, thereby sparking another wave of subsidised housing speculation and downstream demand for the heavy industrial sector. On the other, the administration’s oft-stated and pragmatic desire to tackle housing affordability concerns, and their desire to ignite the latent consumption impulse, might argue for a very public sacrifice of the developers. Taken together with the current focus on inflationary risks – both immediate and medium term – and a disinflationary trend emanating from residential real estate doesn’t appear to be wildly inconsistent with the broader aims of policy. Whatever balance the policymakers strike, the implications will resonate far afield.
Click Here To Scroll Thru My Recent Post ListBy Mike "Mish" Shedlock
http://globaleconomicanalysis.blogspot.com
Mike Shedlock / Mish is a registered investment advisor representative for SitkaPacific Capital Management . Sitka Pacific is an asset management firm whose goal is strong performance and low volatility, regardless of market direction.
Visit Sitka Pacific's Account Management Page to learn more about wealth management and capital preservation strategies of Sitka Pacific.
I do weekly podcasts every Thursday on HoweStreet and a brief 7 minute segment on Saturday on CKNW AM 980 in Vancouver.
When not writing about stocks or the economy I spends a great deal of time on photography and in the garden. I have over 80 magazine and book cover credits. Some of my Wisconsin and gardening images can be seen at MichaelShedlock.com .
© 2011 Mike Shedlock, All Rights Reserved.
© 2005-2022 http://www.MarketOracle.co.uk - The Market Oracle is a FREE Daily Financial Markets Analysis & Forecasting online publication.