


Why the S&P is Rigged? One Chart Says It All
Stock-Markets / Market Manipulation Feb 17, 2011 - 03:56 AM GMTBy: Justin_John

 Try sending this to everyone and hopefully someone from FED will read it. They should finally know that we arent that stupid really and this time around, retail will not come in at PEAK to save the FED and cronies.
We have a situation where S&P has been UP for over 10 weeks and even the greatest skeptics among us will start believing the recovery story purported by Bernanke and his cronies. Obama is absolutely clueless about what is happening. He is a moron of probably a higher standard then even Italian prime minister Silvio Berlusconi who at least is a high performer in one area of his life.
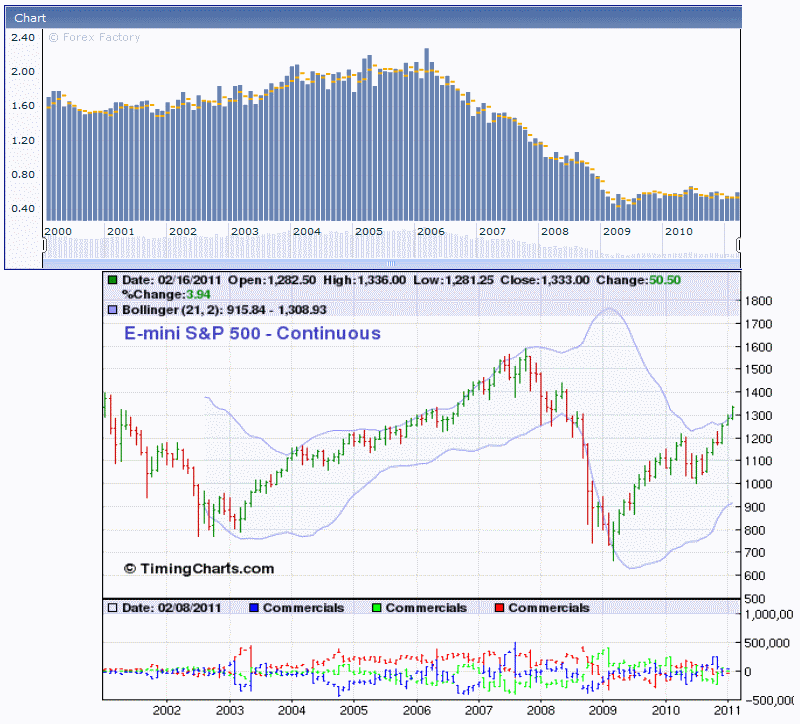
The above chart tracks housing starts to the S&P. I have chosen new house starts but the truth is that you can chose any housing parameters and they will all say a similar story.
The Housing starts represents the construction of new homes in the previous month annualized (x12).
This data is slightly overshadowed by Building Permits because they are tightly correlated and a permit must be issued before a house can begin construction;
It’s a leading indicator of economic health because building construction produces a wide-reaching ripple effect. For example, jobs are created for the construction workers, subcontractors and inspectors are hired, and various construction services are purchased by the builder. The housing starts came in at 0.6 Mn homes / year which has beaten the expected 0.55 Mn homes in January 2011 (reported annualized). It was the euphoria around the fact that the numbers beat the estimate that got me excited last night to take a look if there was something note worthy here.
US housing starts beat expectations of 0.55 Mn homes and came in 0.6Mn houses in January 2011 beating December numbers of 0.52Mn homes by 15% on a month on month basis. That is a remarkable feat as long as you focus on two months duration. Extend the numbers to 2000 January and you see why these numbers have no significance. Between 2001 and 2006, US economy recorded 1.75 Mn housing starts on an average every Month (annualized). But the decline began in April 2006 even as no one was noticing what was happening. It was only in 2008 that folks started to notice that the economy core driver was now down over 50% from its peak in 2006. It was shocking revelation and yet it was overshadowed by Lehman.
Housing fall did not stop there. It went to 0.46 Mn in May 2009. Reading since then have fluctuated between 0.5 and 0.6 Mn. Every time the numbers sway to 0.6 Mn homes, FED has their PR making sure that the recover is ell noted and S&P crooning upwards wiping away the shorts. S&P today is 1336 levels and overlaying of housing charts and S&P will tell you the remarkable rigging of the equity index. S&P last touched 1300 when new housing starts was at 2.20 Mn homes. Today S&P has touched 1336 while housing starts are at 0.6 Mn. Every single data pointing regarding US economy will tell of a similar story except earnings of the corporate sector which are similar to the story in 2006. But the earnings have been driven by exports and which do not make sustainable contribution to the core of the US economy.
Zerohedge has noted the 18 weeks of equity outflows in the US. That was no coincidence. Capital is flowing out of US markets. S&P moves have been calibrated on all time low volumes. It is a desperate strategy of a lost central bank who has run out of all tools. And to top it all, we have a president who cannot find his bottoms with both his hands………..
I am one of the most bearish guys on the US economy and have been consistently so since the Iraq war began. US economy is a dead cat bouncing around. No amount of money can save this economy as there is way too much leverage in the economy and the FED refuses to accept that we need a different approach. It is anyways too late and nothing can save this country from being a third world economy. The last frontier saving the collapse of the wall is the US dollar which allows the FED to print and print, auction and auction.
The US dollar has already shown that its days are numbered. Egypt could not even give it 0.5% gain to the US dollar. Iran Warships in suez canal did not cause a ripple in the US dollar. Tunisia, Algeria have not even been events for the US dollar. Al this while bloggers have been calling for a structural reversal in the US dollar from its lows to at least 80 levels and EUR/USD to 1.3 levels. All the positive data of the past weeks have flown under the bridge. And there is the question of US startegic interests. There has been systematic fall in US leverage abroad. Wikileaks create a lot of bad blood in the asian economies and have sown seeds of doubt. They have already lost Tunisia and Egypt. US could not even save Egypt Mubarak, how will it be able to save Bahrain and Saudi from being outside US influence?
Given the systematic break down os US influence both socially and economically, is the US dollar losing its safe haven status? If that be the case which I strongly suspect, US economy final few months are here and the final blow will come once Muni bonds roll over begin in Oct. There is no chance that $ 3 Trillion muni bonds can be rolled over with yields sub 5%.
I do feel for the American citizens awaiting a fate that no country has seen in our life times. Not even UK in 1930′s.
Try sending this to everyone and hopefully someone from FED will read it. They should finally know that we arent that stupid really and this around, retail will not come in at PEAK to save the FED and cronies.
Source: http://dawnwires.com/investment-news/why-the-sp-is-rigged-one-chart-says-it-all/
By Justin John
Justin John writes for DawnWires.com and is a Director at a European Hedge Fund.
© 2010 Copyright Justin John - All Rights Reserved Disclaimer: The above is a matter of opinion provided for general information purposes only and is not intended as investment advice. Information and analysis above are derived from sources and utilising methods believed to be reliable, but we cannot accept responsibility for any losses you may incur as a result of this analysis. Individuals should consult with their personal financial advisors.
© 2005-2022 http://www.MarketOracle.co.uk - The Market Oracle is a FREE Daily Financial Markets Analysis & Forecasting online publication.