


The Truth About Gold
Commodities / Gold and Silver 2011 Feb 04, 2011 - 03:33 AM GMTBy: Anthony_J_Stills

 Egypt seems to be coming apart at the seams and the unrest may be spreading to Jordan as the King fired members of his cabinet in order to stave off potential problems. Then comes Saudi Arabia and pent up resentment against that royal family. We already know that Tunisia and Syria are experiencing difficulties and it's not far from where we are today to a Middle East engulfed in an uprising. Bin Laden and the Taliban have been planting seeds for ten years and thanks to a very short sighted American foreign policy, it looks like they'll bare fruit sooner rather than later. Now the US is doing what it always does, calling for the removal of a man they supported for twenty years. Justified or otherwise such an about face sends a signal to the rest of the world that our word is not our bond and any friendship is fleeting at best.
You would think that with such a potential problem brewing in the Middle East, the gold price would be flying high. Think again! Here you can see a six-month daily chart and most of that time has been spent going sideways:
Here I have posted the three important Fibonacci numbers: support at 1,298.10, resistance at 1,372.80 and the top at 1,447.50
Gold has spent the better part of four months trading between the strong Fibonacci support at 1,298.10 and the strong Fibonacci resistance up at 1,447.50. This has caused a lot of people to claim that a top is being put in, but I disagree. If you go back and look at the history of the eleven-year-old bull market, you'll see that there has never been a single instance of gold ending a drive with a rounded top. All secondary rallies have ended with a spike to the upside and exhaustion. This rally will do the same thing.
An awful lot is being said about gold right now but little of the commentary seems to capture the investing public's attention. Maybe because there is no one clear message. Marc Faber says gold is going to correct to 1,100.00 while Jim Sinclair says it's going to 1,650.00 or higher. Elliot Wave says the bull market is over, but then they've made that declaration a number of times over the last five years and haven't gotten it right yet. Is it any wonder the man on the street avoids the yellow metal?
Way back when I had a price target of 1,298.10 and then readjusted it up to 1,447.50. So far the closing high in the February contract has been 1,425.10 on January 3rd, not all that far away. Since then gold has corrected down to the 1,319.80 closing low on January 27th and an intraday low of 1,309.10 intraday low on January 28th. If you measure the fall from the January 3rd closing high to the January 27th closing low, the yellow metal has corrected 8.70%. If you listen to the financial news networks they make it sound like the end of the world, and since most folks believe everything they hear on TV, they react accordingly. The truth is that an 8.70% correction is shallow to say the least.
Since gold made he low on January 27th, it has posted higher intraday lows on four out of the last five sessions, today being the only exception. Here are the intraday lows for the last five sessions:
January 28th 1,309.10 January 31st 1,323.60 February 1st 1,326.00 February 2nd 1,327.30 February 3rd 1,325.40
Note that these are intraday lows for the February gold futures contract and all the last four are at or modestly above good Fibonacci support at 1,323.30. Every time we get down there someone buys gold. That someone is probably China, India and Russia.
Now I want you to take a good look at the following chart that marks each significant low going back to the beginning of the bull market for the yellow metal:
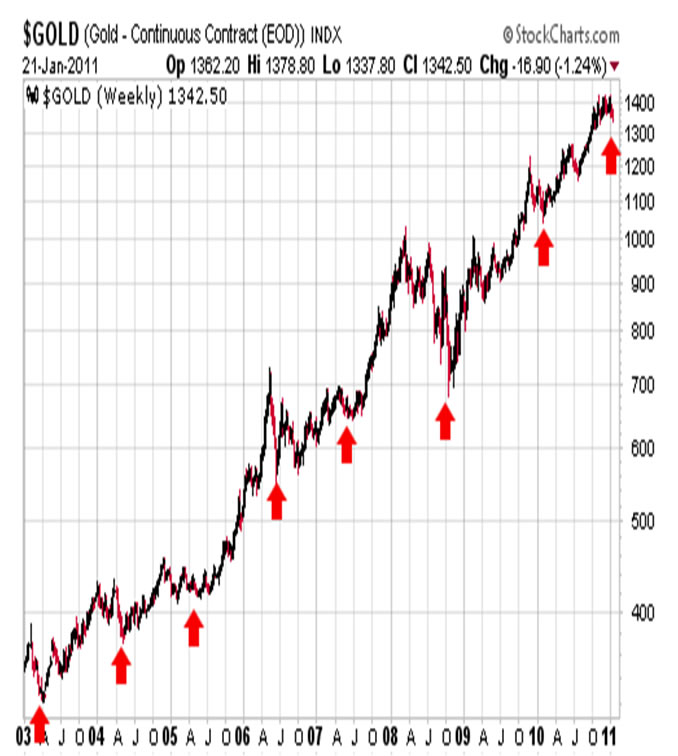
These correspond to the cycle work taken from the McClellan Market Report. McClellan has discovered that a cycle low appears for goldroughly every 12.5 months. The cycle lows have run as follows: Jan 6, '06, Jan 8, '07, Jan 7, '08, Jan 5, '09, Jan. 4, '10, and Jan. 8, '11. McClellan puts the next cycle bottom for gold at February 8, 2011. So the cycle low for gold should arrive this week and when you put at any time between now and February 8, give or take a few weeks before or after that date. I think it lends credence to McClellan´s work that this cycle bottom for gold is due to arrive amid a good deal of professional bearishness regarding gold ("gold overdue for a major correction").
Furthermore if you look at the Commitment of Traders report you'll note a significant fund long side liquidation that continues even today. As of Tuesday the total open interest remaining in gold was down to 463,700 contracts, and I suspect it has dropped even further since then. This is compared to the peak in open interest of 650,764 contracts back in November of last year. Interest is down nearly 190,000 contracts in the just 9 weeks! In spite of the massive sell-off, gold has only fallen some 8.70% in the face of this huge exodus of speculative money. It should also be mentioned that the funds historically get it wrong with gold and serve as lunchmeat for the commercial traders. This also tells me that the short side of the market (the bullion banks and the swap dealers) will be forced to aggressively cover shorts at the first sign of a move higher. I think the sign will be here shortly.
A look at a two-year daily chart of gold shows that the secondary trend for gold remains intact and what's more it also shows that we've seen these periods of sideways movements before:
and on previous occasions they have all been followed by a break out to the upside. I am convinced that this time around will be no exception to the rule. I am also convinced that almost all investors lack patience so when gold takes off, no one will be on board the train. Bull markets are always like that and a bull market in gold is more difficult than most due to the emotions of greed and fear being magnified by the presence of gold. By the time the average investor comes to the conclusion that gold is in fact going to 1,447.50, 1,522.20, and probably as high as 1,597.00, it will be too late and they'll only begin to buy when the smart investor is starting to sell in anticipation for the real correction that will follow. That's the way it always is.
[As I was writing the last paragraph gold in fact surged to 1,350.00 so it is beginning to look like the bottom is really in. My best advice is to buy if you haven't and sit tight if you in fact own gold.]
Anthony J Stills Steve Betts
as@theablespeculator.com sb@theablespeculator.com
© 2011 Copyright Anthony J. Stills - All Rights Reserved
Disclaimer: The above is a matter of opinion provided for general information purposes only and is not intended as investment advice. Information and analysis above are derived from sources and utilising methods believed to be reliable, but we cannot accept responsibility for any losses you may incur as a result of this analysis. Individuals should consult with their personal financial advisors.
© 2005-2022 http://www.MarketOracle.co.uk - The Market Oracle is a FREE Daily Financial Markets Analysis & Forecasting online publication.