How a Straight Line on a Chart Helps You Identify the Trend
InvestorEducation / Technical Analysis Feb 01, 2011 - 11:10 AM GMTBy: EWI
 Technical analysis of financial markets does not have to be complicated. Here are EWI, our main focus is on Elliott wave patterns in market charts, but we also employ other tools -- like trendlines.
A trendline is a line on a chart that connects two points. Simple? Yes. Effective? You be the judge -- once you read the free 14-page Club EWI report by EWI's Chief Commodity Analyst and Senior Tutorial Instructor Jeffrey Kennedy.
Enjoy this free excerpt -- and for details on how to read this report in full, free, look below.
Trading the Line -- 5 Ways You Can Use Trendlines to Improve Your Trading Decisions
(Free Club EWI report, excerpt)
Chapter 1 Defining Trendlines
Before I define a trendline, we need to identify what a line is. A line simply connects two points, a first point and a second point. Within the scope of technical analysis, these points are typically price highs or price lows. The significance of the trendline is directionally proportional to the importance of point one and point two. Keep that in mind when drawing trendlines.
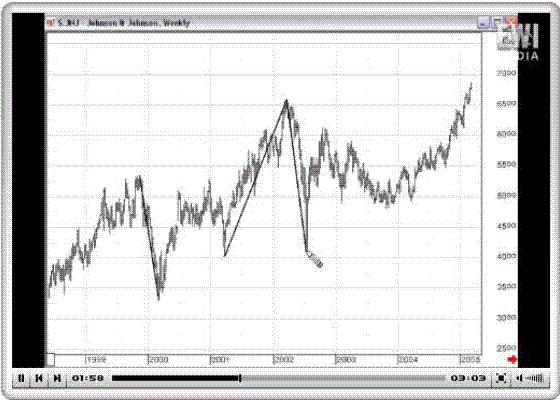
A trendline represents the psychology of the market, specifically, the psychology between the bulls and the bears. If the trendline slopes upward, the bulls are in control. If the trendline slopes downward, the bears are in control. Moreover, the actual angle or slope of a trendline can determine whether or not the market is extremely optimistic, as it was in the upwards sloping line in Figure 1-1 or extremely pessimistic, as it was in the downwards sloping line in the same figure.
You can draw them horizontally, which identifies resistance and support. Or, you can draw them vertically, which identifies moments in time. You primarily apply vertical trendlines if you’re doing a cycle analysis.
Chapter 2 Drawing Trendlines
In this section, I’ll show you how I draw trendlines. I’ll start with the most common, simple way to draw them...
For more free trading lessons on trendlines, download Jeffrey Kennedy's free 14-page eBook, Trading the Line – 5 Ways You Can Use Trendlines to Improve Your Trading Decisions. It explains the power of simple trendlines, how to draw them, and how to determine when the trend has actually changed. Download your free eBook.
This article was syndicated by Elliott Wave International and was originally published under the headline Trendlines: How a Straight Line on a Chart Helps You Identify the Trend. EWI is the world's largest market forecasting firm. Its staff of full-time analysts led by Chartered Market Technician Robert Prechter provides 24-hour-a-day market analysis to institutional and private investors around the world.
© 2005-2022 http://www.MarketOracle.co.uk - The Market Oracle is a FREE Daily Financial Markets Analysis & Forecasting online publication.


