


Swiss Franc … CHFUSD
Currencies / Forex Trading Jan 31, 2011 - 03:06 AM GMTBy: Tony_Caldaro

 We have been tracking on stockcharts eight currencies now for a few years: AUD, CAD, CHF, EUR, GBP, JPY, USD and the ZAR. The charts we offer are all in relation to the USD, and we track the DXY index for the USD. Some time ago we expanded our long term time cycle analysis to include currencies. We have posted about this 34 year secular cycle in the past, and some of its components.
After an extensive analysis we determined that the CHFUSD is the model currency relationship for these time cycles. Historically, the CHF has been a steady currency with the foundation of a solid banking system in Switzerland. Over the last decade, or so, the CHF has become more and more of a fiat currency as it is no longer backed by any money (Gold) at all. And, the private banking system has been opened to foreign government scrutiny. Nevertheless, the CHF continues to be the steadiest of the eight currencies we track.
The following chart displays the CHFUSD over the past 40 years. Observe the upside progress made in relationship to the consistent devaluation of the USD during this period of time. The USD chart looks about the same but naturally inverted.
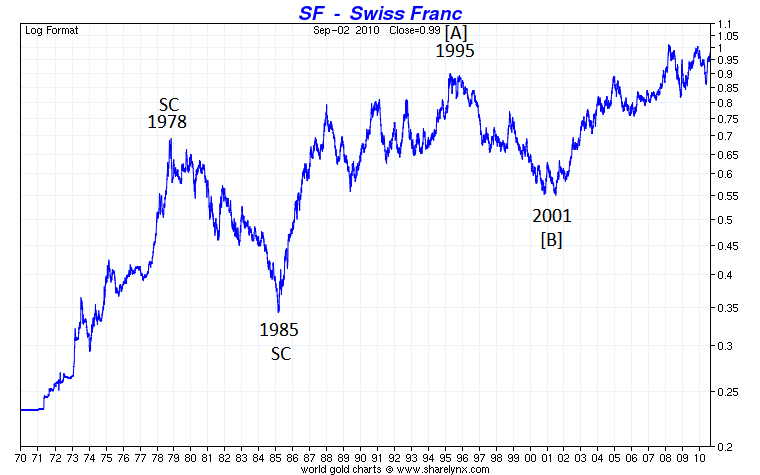
Our long term time cycles suggest Secular peaks occur every 34 years, i.e. 1978 and est. 2012. Secular lows also occur every 34 years, but only offset by 7 years, i.e. 1985 and est. 2019. Within each 34 year secular cycle there are three shorter Cycle waves: [A], [B] and [C]. Each of these Cycle waves last between 6 and 11 years, with the [B] wave the shortest and [A] and [C] waves the longest. Overall it takes about 17 years to go from peak to peak, and bottom to bottom. Each Cycle wave (6 – 11 years) subdivides into shorter term Primary waves, which many would term bull and bear markets. These Primary waves last between 1 and 3 years.
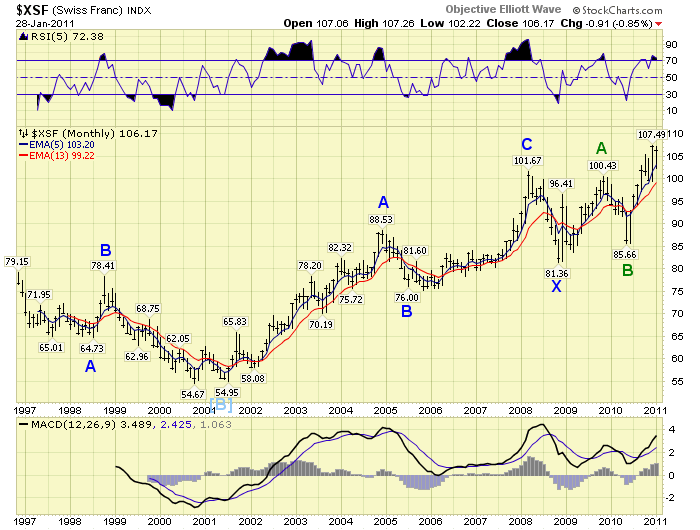
This next chart displays the later stages of Cycle wave [B] as it was bottoming in 2001, and nearly all of the est. 11 year Cycle wave [C]. Observe the Primary wave A bull market from 2001-2004 (0.55 – 0.89), the Primary B bear market into 2005 (0.89 – 0.75), and the Primary C bull market into 2008 (0.75 – 1.02). When the economic meltdown occurred in 2008 most currencies declined substantially except the USD. This was the Primary X wave bear market, (1.02 – 0.81), within the larger Cycle [C] wave bull market for this CHFUSD pair.
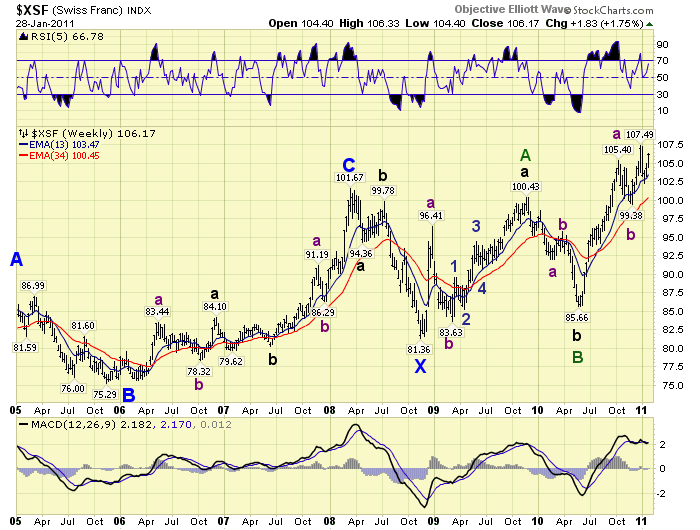
The following is weekly chart of the same events from the Primary A wave high in 2005. Observe how the Primary waves divided into uptrends/downtrends (waves) as their bull/bear markets unfolded. Those of you who track the currency markets will notice these movements are usually not five wave structures, but threes. Currencies trade like commodities.
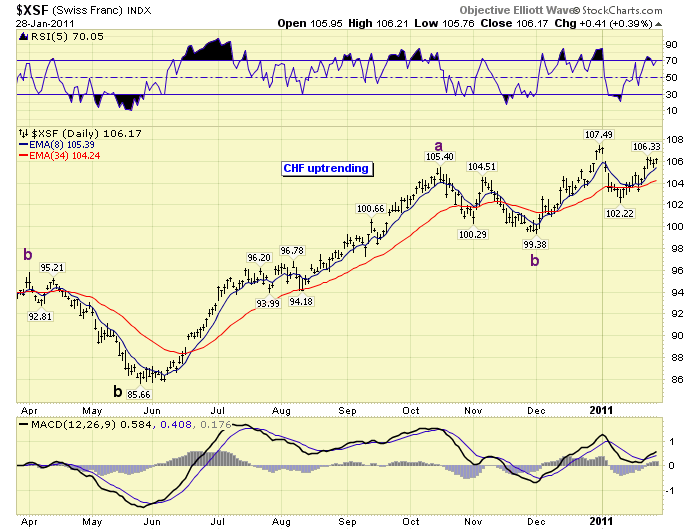
This last chart is the daily activity. It displays the CHFUSD has been in an uptrend since early December.
When we consolidate all this information we arrive at the following conclusions. We’re expecting a Primary bull market, Cycle wave bull market, and Secular wave top around the year 2012. Then we anticipate the CHFUSD will enter a 7 year Secular bear market into 2019. Long term price relationships suggest Cycle wave [A] had a 0.56 rise and Cycle wave [C] will equal this rise at $1.11, i.e. 0.56 +0.55 = $1.11. Currently the CHF is around $1.06. This suggests there is limited upside potential for 2011 into the top in 2012. Unless, of course, there is some volatility this year. The long term trend, however, is up until 2012.
CHARTS: http://stockcharts.com/def/servlet/Favorites.CServlet?obj=ID1606987
http://caldaroew.spaces.live.com
After about 40 years of investing in the markets one learns that the markets are constantly changing, not only in price, but in what drives the markets. In the 1960s, the Nifty Fifty were the leaders of the stock market. In the 1970s, stock selection using Technical Analysis was important, as the market stayed with a trading range for the entire decade. In the 1980s, the market finally broke out of it doldrums, as the DOW broke through 1100 in 1982, and launched the greatest bull market on record.
Sharing is an important aspect of a life. Over 100 people have joined our group, from all walks of life, covering twenty three countries across the globe. It's been the most fun I have ever had in the market. Sharing uncommon knowledge, with investors. In hope of aiding them in finding their financial independence.
Copyright © 2011 Tony Caldaro - All Rights Reserved Disclaimer: The above is a matter of opinion provided for general information purposes only and is not intended as investment advice. Information and analysis above are derived from sources and utilising methods believed to be reliable, but we cannot accept responsibility for any losses you may incur as a result of this analysis. Individuals should consult with their personal financial advisors.
© 2005-2022 http://www.MarketOracle.co.uk - The Market Oracle is a FREE Daily Financial Markets Analysis & Forecasting online publication.