


Stock Market Top at Technical Resistance?
Stock-Markets / Stock Markets 2011 Jan 30, 2011 - 11:05 AM GMTBy: JD_Rosendahl

 For the past few months, I've been calling for some kind of stock market top, with January 2011 as my preferred time frame. From the July 2010 lows to Thursday's close was a Fibonacci 144 days. Friday's minor new high might be the top I'm looking for.
For the past couple weeks I kept saying the market could test the 1,300 to 1,310 levels as part of that top. And last Thursday, Art Cashin said to watch the 1,303-1,304 resistance area: Watch S&P's New Resistance Are: Art Cashin
Friday's high was 1,302.67!!! The price action Friday was constructively bearish, indicating further selling pressure in the near future and a correctional phase may have begun.
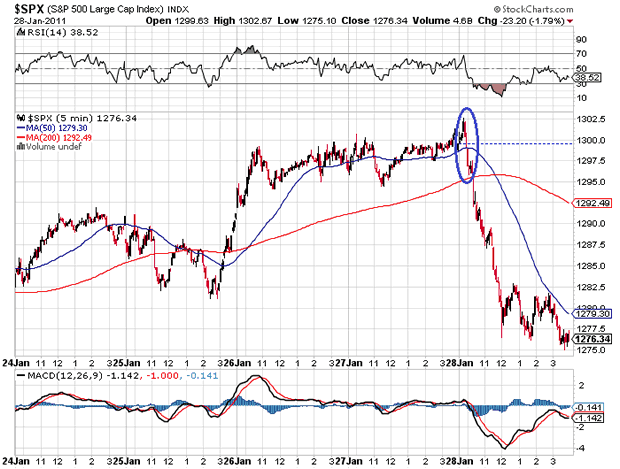
$SPX 5 Minute: On the 5 minute chart we have a 3 Black Crows pattern down from the top, which is a bearish pattern often stemming from a high point and is usually followed by additional selling pressure, which we got all day on the 5 minute chart.
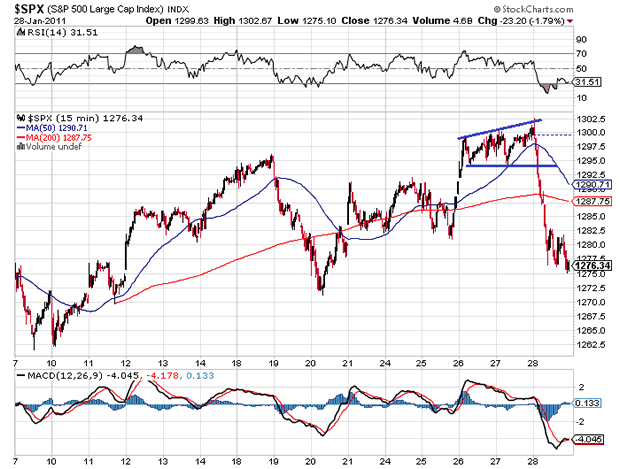
$SPX 15 Minute: The market made a minor high Friday to finish what look looks like a broadening top.
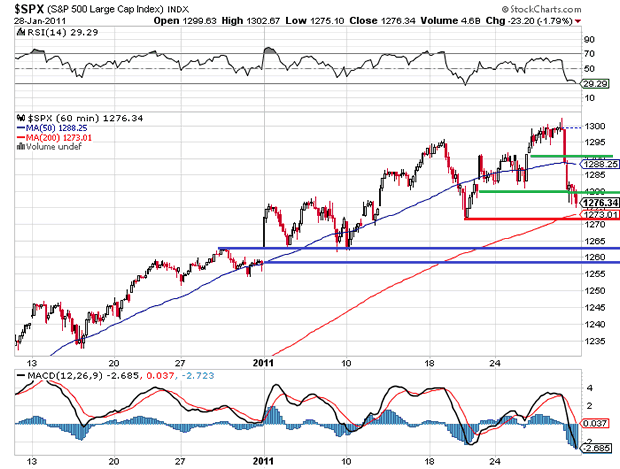
$SPX 60 Minute: Thursday, I said I liked the idea of the market trading lower Friday and even closing the gaps in green and red. I also said that it's not bearish until we make a lower low, which we have not done yet on the 60 minute charts. A break below the 200 period MA and closing the gap in blue are solid signs of a correctional phase.
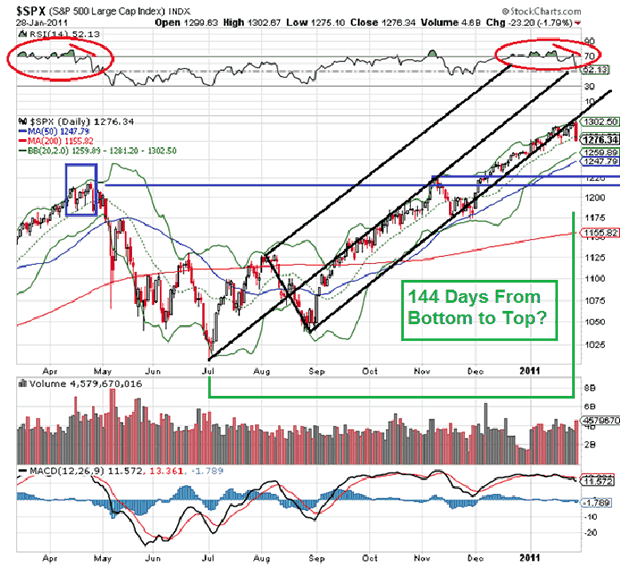
$SPX Daily: There's a lot of great technical data in the daily chart. Thursday was the Fib. 144 day from the July 2010 low. We also have some similarities brewing in this high compared to the April 2010 top: look at the April high and we see price making a high and then going through a one day sell off then advancing for 5 days into a minor new high while creating a divergence on the RSI. In the past several days we have the same structure. And on both occasions, the market pushed the RSI into 70 for a month. Now look at the pitchfork lines, the April high finished right on the middle line. The January high is finishing by back testing the lower line. If this is the market high I'm looking for the correctional phase to continue next week. The lower BB and 50 day MA is the first support area. Price support in blue is major support.
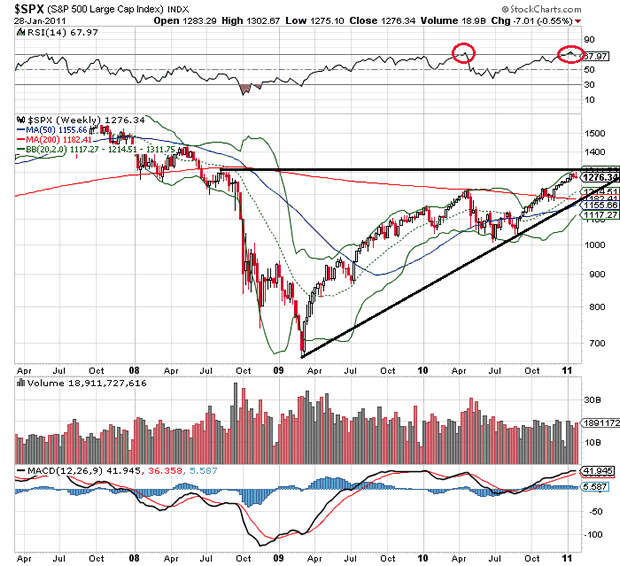
$SPX Weekly: We've reversed off the RSI at over bought just like the April top. Price is stalling just below the upper BB. The April 2010 high, the 200 day MA and uptrend line make likely cluster support we test.
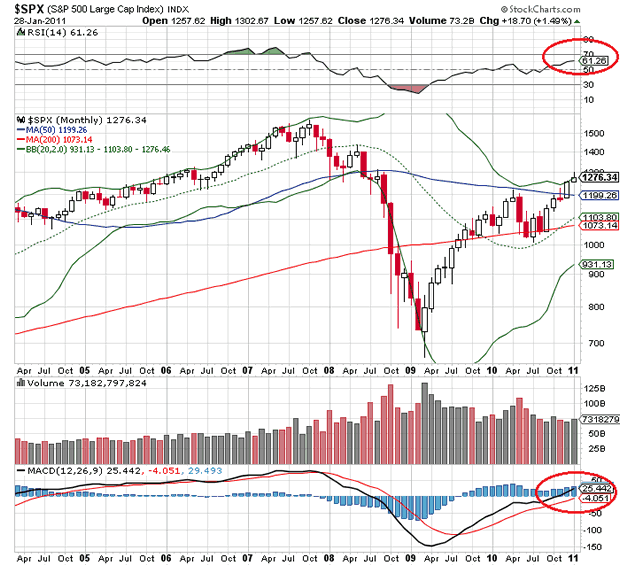
$SPX Monthly: The monthly time frame is the only time frame not reflecting any bearish clues. It leaves the door open to support bulls in Time Frame Indifference, which could mean the markets continue higher without a correctional phase (Not my view) or hold the correctional phase to something of a more normal correction in price and/or time. For the monthly time frame to support the most bearish of Elliott Wave counts, the MACD needs to roll over. As stated a couple times recently, I likely the idea of Mr. Market finishing near the highs for January. After Friday, I also like the idea of the market closing near where it started for the month. Mr. Market loves to push price into a place that puts Bull and Bears on edge, and either one of those should do just that on the monthly chart.
The Bearish View: I've been stating for weeks and months I thought January 2011 would put in some kind of top for Mr. Market. At this point, I'm going to leave it at we are due for correctional behavior in price and/or time.
If the bearish view is going to continue next week this is how it might happen: On the intraday, we should see some kind of brief bounce (wave ii) and selling pressure to continue after that and we need to close the gap in blue on the intraday chart and create a lower low on that time frame.
We might get a down day on Monday and Tuesday creating a 3 Black Crows pattern on the daily chart with next week being a down week, which will create follow through downward on the weekly chart.
On the monthly chart, if Monday is down for the day it could push the closing price for the month near the start of the month creating a bearish candlestick for January just like April 2010 and thus the first two candlesticks of a 3 month Evening Star would be in place. That would leave the door open for a down month in February to potentially finish that pattern. That would all support the most bearish of Elliott Wave Views.
It will be interesting to see how next week plays out!
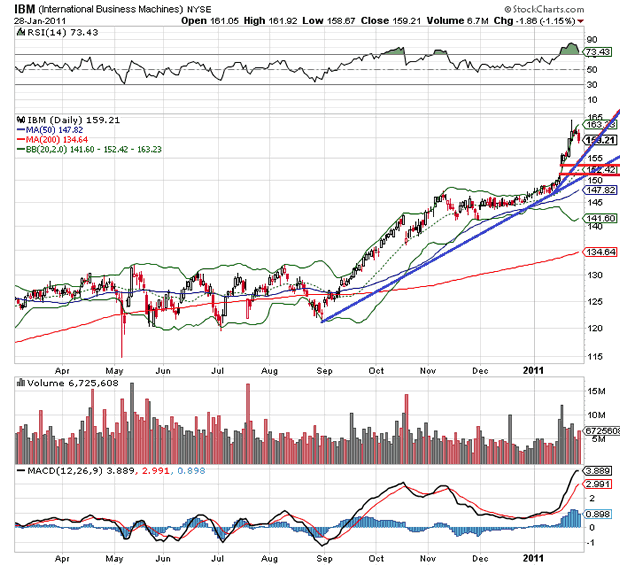
IBM: A little sell side pressure in big blue has finally rolled the RSI over from very over bought levels. It's not really a bearish indicator for the market until it trades below trend lines and gap support. It could easily consolidate before making another high because there are no divergences.
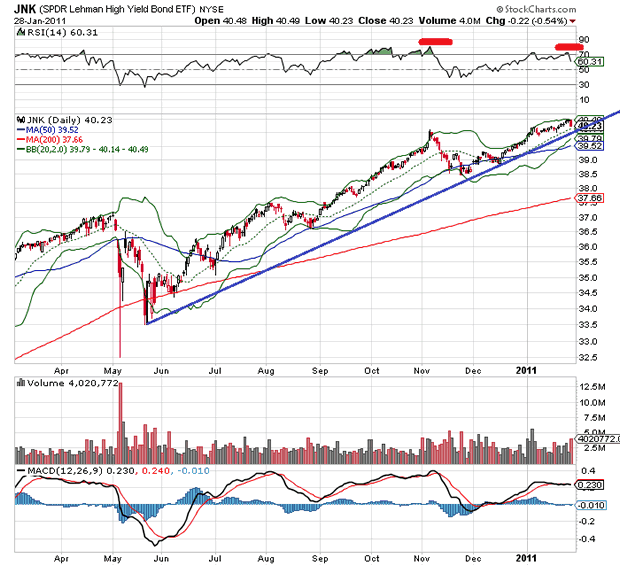
JNK: A little down day Friday and we might have finished 5 waves up from the Nov 2010 low. Divergences in place. Below the trend line is a bearish a sign the risk trade is coming off for Mr. Market.
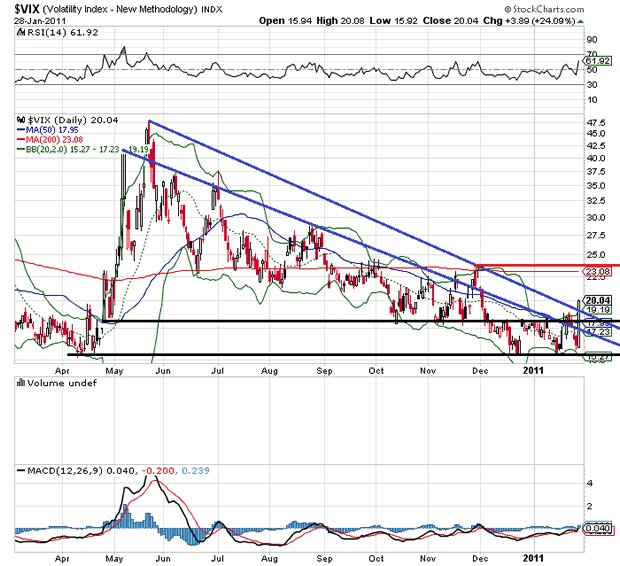
$VIX: Finally, we have a break out and over all down trend lines. If this is going higher, the red line and 200 day MA should be the next stop.
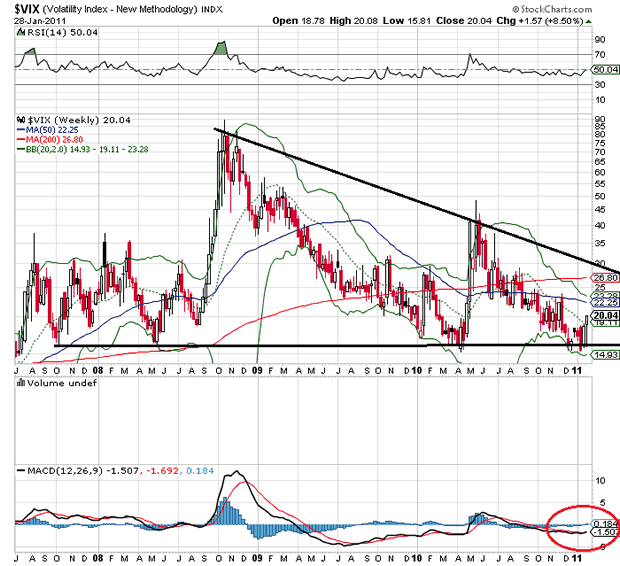
$VIX Weekly: The MACD is trying to turn up after bouncing off support and it could easily move up to the down trend line.
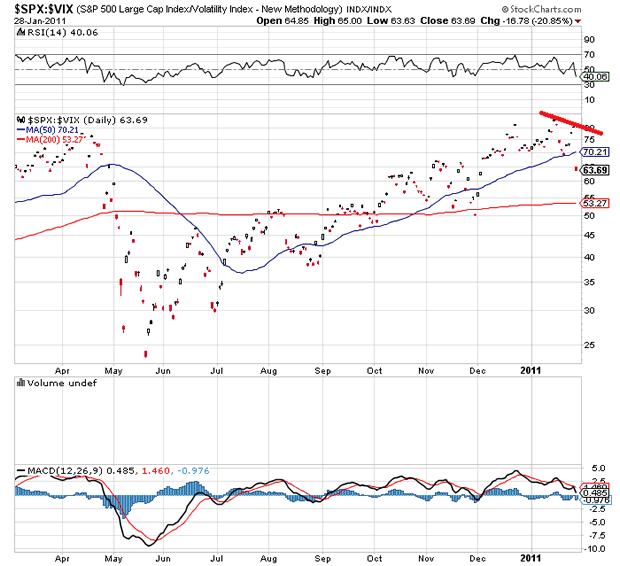
The Risk Chart: The Risk Chart has created a divergence with a lower high compared to the stock market.
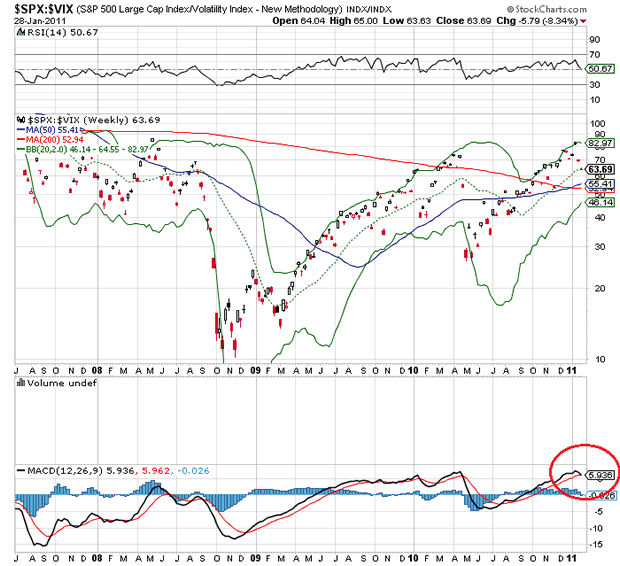
$SPX Weekly: On the weekly, the MACD is trying to roll over.
My Watch List and From My Trading Desk: To see my most recent trades and charts I'm looking at now go to www.roseysoutlook.blogspot.com
Happy Trading.
By J.D. Rosendahl
www.roseysoutlook.blogspot.com
J.D. Rosendahl was a former stock broker/investment consultant (currently not licensed) before becoming a Commercial Banker for the past 14 years. He manages his family's wealth, helping them avoid the high tech bubble and the real estate bubble melt downs and preserving wealth.
© 2011 Copyright J.D. Rosendahl - All Rights Reserved
Disclaimer: The above is a matter of opinion provided for general information purposes only and is not intended as investment advice. Information and analysis above are derived from sources and utilising methods believed to be reliable, but we cannot accept responsibility for any losses you may incur as a result of this analysis. Individuals should consult with their personal financial advisors.
© 2005-2022 http://www.MarketOracle.co.uk - The Market Oracle is a FREE Daily Financial Markets Analysis & Forecasting online publication.