


Gold, Commodities Divergence Against Baltic Dry Index Trend
Commodities / Commodities Trading Jan 07, 2011 - 05:38 AM GMTBy: Anthony_J_Stills

 For weeks now I have been going on about the divergence between the commodities prices and the Baltic Dry Index as the former rallies while the latter sinks almost daily. Last night was no exception as the Baltic Dry Index took another big dive as you can see here:
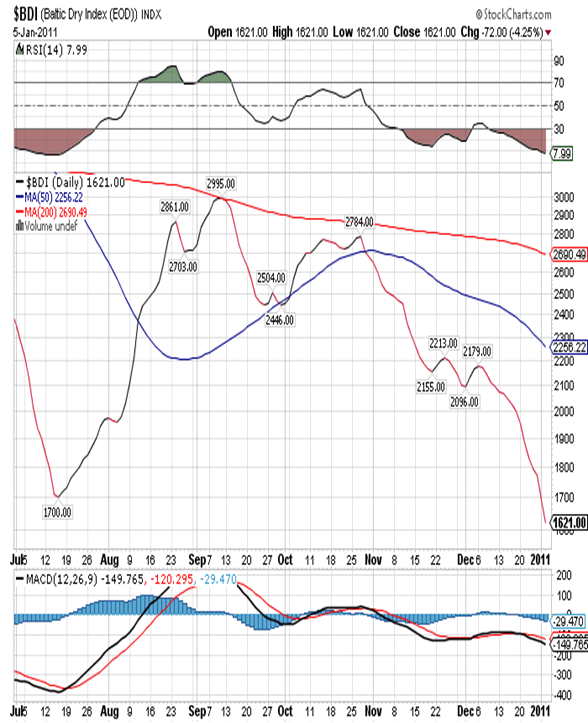
The Index dropped another 72 points, after a 5% drop the day before, to close at 1,622. This is a second consecutive close below the 2010 low of 1,700 and a confirmation of the break.
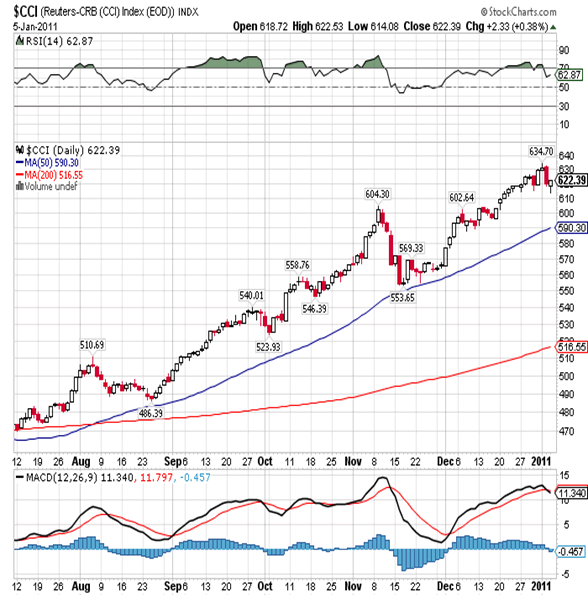
In spite of being extremely oversold you can see that the MACD has turned down yet again indicating that there is more downside to come. Perhaps more importantly you need to understand that the BDI is a measurement of the rates for chartering giant ships that carry iron ore, coal, grains, sugar, cotton and the like, and rates are dropping like a stone. This is puzzling behavior since most of the aforementioned commodities are close to or at record highs. Take a look at the chart of the CRB below for confirmation:
What’s even more confusing is that both these indexes have been joined at the hip for years, at least until April 2010 when they went there separate ways as you can see here:
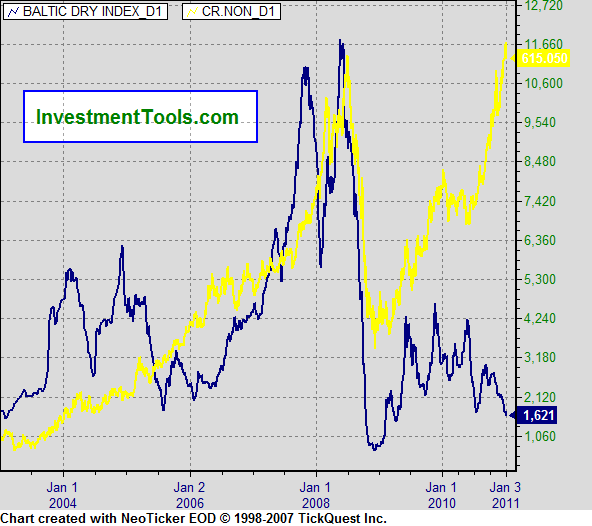
I really don’t have a decent explanation for this phenomena but I do believe that the BDI is an accurate reflection of demand. Therefore I have to wonder if the commodities market isn’t pricing in some sort of severe supply shortage. The other explanation is that the commodities market is pricing in inflation while the BDI is pricing in deflation.
There is one other factor that I would like to mention and that’s the fact that crude oil has not been able to break out to the upside like the other commodities and you can see this in this daily chart:
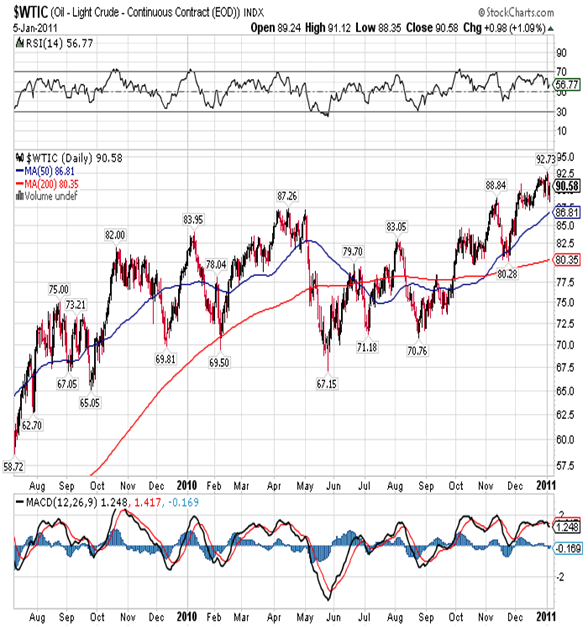
Although price did break out above the top of the range that goes back more than a year, it is down more than one dollar today and almost back within that range. It should be mentioned that crude shipments are not part of the BDI. Why is crude weak relative to the rest of the commodity sector? The Chinese are buying cars like crazy so the demand for oil and gas should be on the rise. Like gold there is less supply every day so the price should be on a real rush higher and it isn’t.
A lot of the rises in the commodities prices have been attributed to a weaker dollar but if you look at a one-year daily chart you’ll see no change in the dollar:
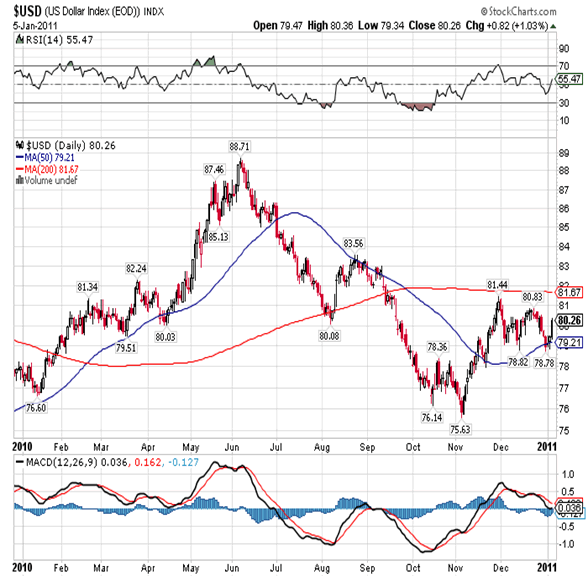
The US dollar has actually posted a slight gain over the last twelve months, so gains in commodities prices again must be due to supply problems. I know that droughts in Argentina and Brazil (grains) are bad, and I know that Peru hasn’t planted any cotton (I don’t know why), and I know that bad weather is affecting sugar and coffee throughout Latin America while a large section of Australia (equal to the size of France and Germany) is under water. Is that the reason? I don’t know but it certainly bears watching and I would be very careful about loading up on commodities thinking that a new bull market is about to erupt.
One of the reasons the US dollar has held up as well as it has involves the fact that other central banks around the world are printing too. The Chilean Peso moved to new lows against the dollar several days ago prompting its Central Bank to announce that they’ll buy US $50 million a day until they have amassed a total of US $60 billion! You have to wonder about the wisdom of accumulating so much of a paper backed by a promise from a debt-ridden society, but that’s the road they are apparently taking. Somehow they feel it’s necessary in order to maintain their competitive edge with exports. They’re not the only ones. I know that Peru, Argentina and Brazil are going down that same path. So far Latin America has escaped the wrath of the economic problems that have ravaged Europe and the US, but this may very well be the straw that broke the camel’s back. It’s not like Bernanke needs any more incentive to print; he probably cranks out greenbacks in his sleep!
Finally, none of this is lost on the bond market as excess supply is pushing down prices. Today they are selling another US $66 billion in bonds and notes and the Fed is purportedly buying US $6.78 billion, but since there is no reliable reporting, there’s no way to know. The 30-Year bond took a big dive yesterday as you can see here:
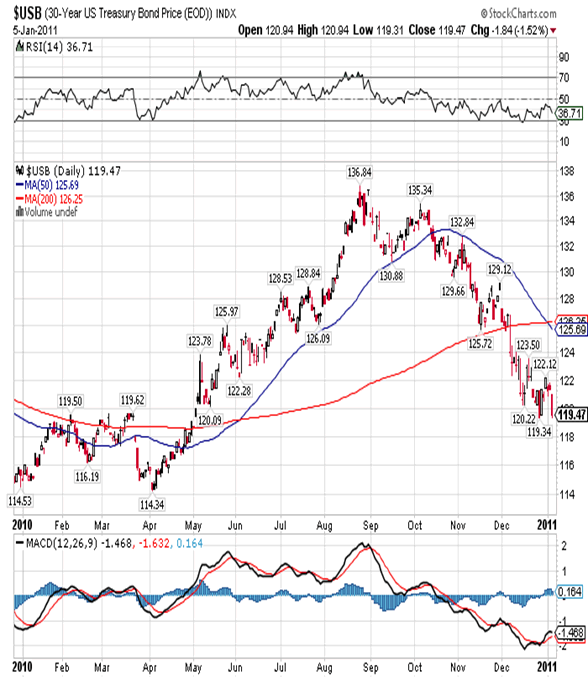
and is close to making new lows for this move down. The bond enjoys good support in the 119.25 area and this is the second attempt to move down through it. My suspicion is that the third time will be a charm, and then bonds will fall down to the 2010 low at 114.34. That of course will push interest rates much higher and strangle an already dying consumer.
In closing we are opening the year with a considerable amount of volatility in currencies, commodities, bonds and gold. This volatility is causing analysts to make some bad calls and investors to dump positions they shouldn’t be dumping. A case in point is a recent headline on www.kitco.com declaring “COMEX gold weaker as Bulls Fade”. I’ve also heard several analysts on Bloomberg calling an end to the bull market in gold, and this is just three days after the yellow metal made a new all-time closing high as you can see here:
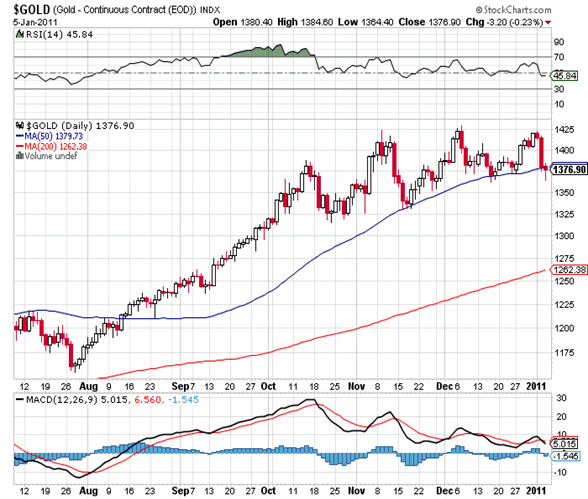
What we’ve seen so far is a three-day reaction with gold making a marginally lower low today at 1,363.90 and then reversing to trade up at 1,374.00, just like it did yesterday. There is good support at 1,365.00 and it is attracting buyers. If today’s low is the low for this reaction, and I believe it is, then gold will have made a higher low. That is extremely bullish! In order to produce a significant top you need to a see a blow-off to the upside just like we saw back in March 2008 (and every significant rally before that). We have yet to see that, but we will. The same holds true for commodities. I am absolutely convinced that this is a hiccup and we will see a surge higher, lasting weeks, in both gold/silver and commodities. That blow-off should take us to the same early March time frame for a top. This blow-off will offer the intelligent investor significant profits, the best of the entire leg up, and that’s why the smart money is buying gold at 1,365.00. Compared to US $1,610.00, it’s a bargain! My best advice is to add on here and turn the TV off. Come back in two weeks and then we’ll talk.
Anthony J. Stills / Steve Betts
analyst@theablespeculator.com
© 2010 Copyright Anthony J. Stills - All Rights Reserved
Disclaimer: The above is a matter of opinion provided for general information purposes only and is not intended as investment advice. Information and analysis above are derived from sources and utilising methods believed to be reliable, but we cannot accept responsibility for any losses you may incur as a result of this analysis. Individuals should consult with their personal financial advisors.
© 2005-2022 http://www.MarketOracle.co.uk - The Market Oracle is a FREE Daily Financial Markets Analysis & Forecasting online publication.