


Deflation Ahead
Economics / Deflation Jan 05, 2011 - 08:15 AM GMTBy: Brian_Bloom

 Recently, I had the privilege of watching the YouTube video below of a lecture given in Australia by Professor Niall Ferguson
In my view, except for the fact that Professor Ferguson did not even make a passing reference to the critical importance of energy in the economic stew, I think he absolutely nailed the current economic situation. He was looking at the world economy from the perspective of long term history – which I believe is most appropriate at this point in time. He is unequivocally of the view that the probabilities favour deflation. For various reasons, I agree with him.
Below is my reasoning:
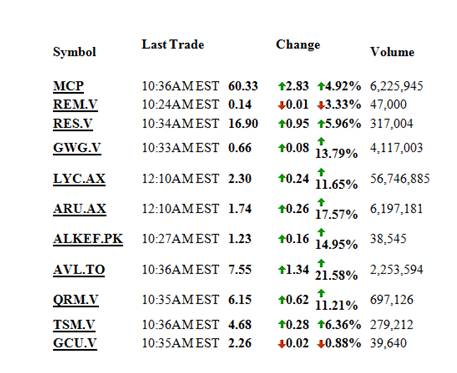
It happens that during the past couple of weeks, a friend drew my attention to the fact that the shares of Rare Earth Elements companies have been going crazy. He sent me the table below pertaining to trade on January 4th 2010:
To get some context I had a look at the long term charts (greater than 5 years). Below is one example: (See http://finance.yahoo.com/q?s=LYC.AX )
The prices of the rare earth minerals companies seem to be back to where they were in 2007/8.
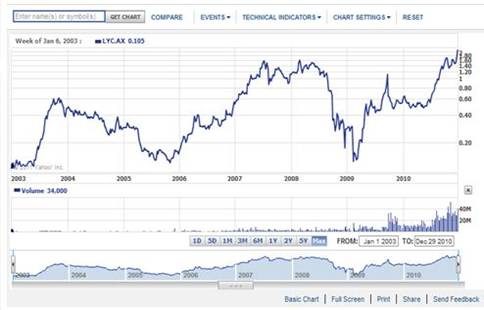
Although volumes have increased dramatically, arguably this may have been “trading” oriented as opposed to investment oriented.
Here’s why:
If you look at the chart of the Shanghai market below, this is what you see:
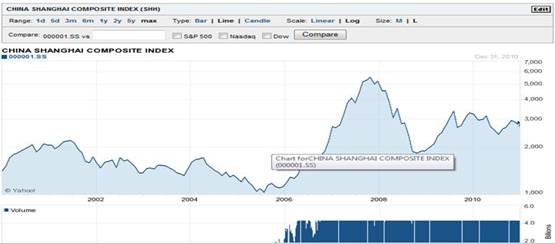
Source: http://finance.yahoo.com/q?s=%5ESSEC
Technically, both (REE and Shanghai) markets are now at “Decision Points” – from which they might break either up or down. Some (not all) REE’s are peeking above Double Tops whilst the Shanghai market is at the apex of a triangle.
Technically, the evidence is pointing to a pullback from these levels; which implies a coming sell signal on the Shanghai Index if Chinese investor sentiment reflects US investor sentiment.
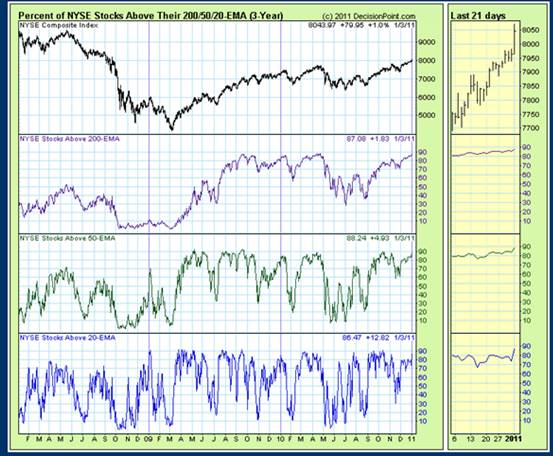
In short, there is (now) too much bullish sentiment about. The following three charts (Source Decisionpoint.com) reflect varying views of sentiment in the US markets
Note from the first chart below that 90% of all NYSE stocks are now trading above their 200 day moving averages
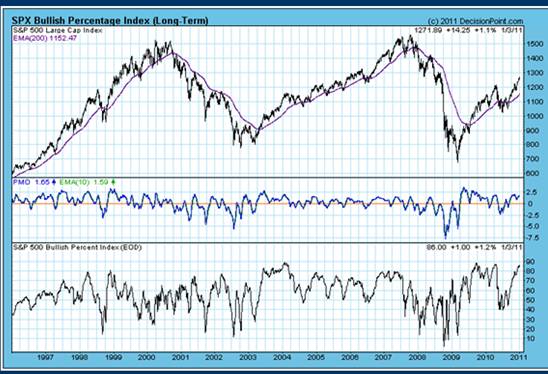
The second chart below shows that the percentage of Point and Figure charts that have given buy signals is now also approaching 90%
Of course, the markets could continue to rise and the sentiment charts could remain in overbought territory. President Obama has made the statement that he will be 100% focussed on getting the economy to grow – so those institutions with money may have been investing in anticipation of this – but have a look at the third chart below: The percentage of investment advisors who are bullish vs bearish.
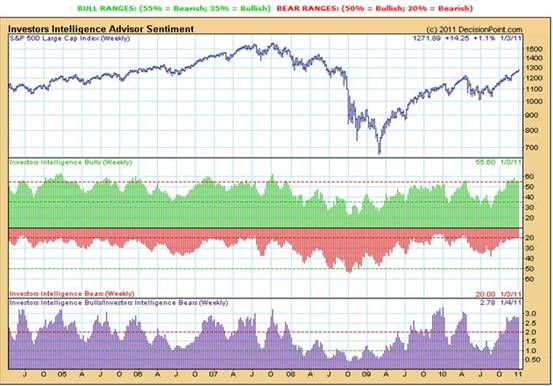
This indicator is unarguably in dangerous territory.
The reason I am focussing on the potential for a bearish double top in the REE’s (notwithstanding the recent “apparent” upside penetration) is that some people have been arguing that the REE craze kicked in following China’s recent cutting of export quotas by around 33% (from memory). In my view, this is too short sighted. The reader will notice from the three charts above that market sentiment was at its most bearish towards the end of 2008. That is also when the REEs bottomed and it was very soon thereafter that they began to rise. i.e. The recent upside penetration of resistance on the REE’s charts may in fact be an overshoot in a final blow off move.
Let’s have a quick look at what the future may hold:
The Price/Earnings ratio chart below – with P/E ratios once again headed into rarefied territory - is showing that the market is expecting earnings to rise
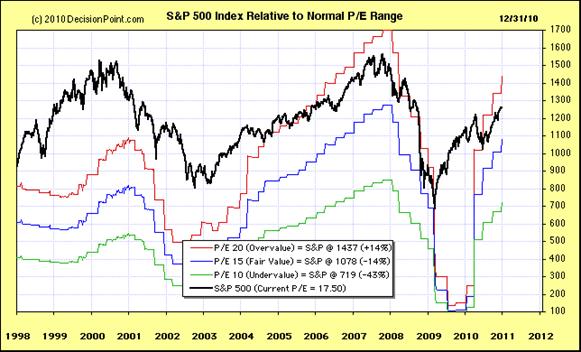
BUT THERE IS A WARNING THAT IS SCREAMING AT US:
“VALUE” IS ABSENT!!”
Traditionally, value is determined by dividend yield on the S&P or Dow Jones. Traditionally, when Dividend Yields are below 3% then the market is overvalued
Have a look at the Dividend Yields in the table below. This is the primary reason why I have remained bearish (Source: DecisionPoint.com)
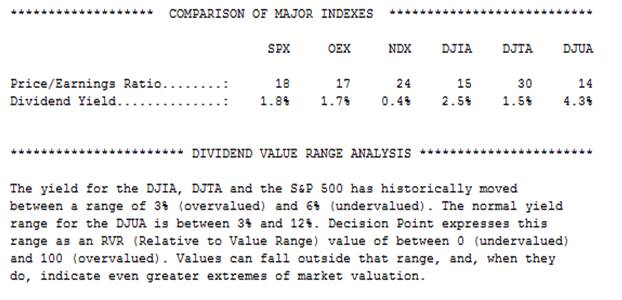
So, overall, right now, the markets are both overvalued and overbought.
Fundamentally, the only reason why the REE’s might genuinely break up into new high territory is if we are entering a brand new era of investment – where the economy of the near term (one to two year) future will be driven by new technologies dependent on REE’s. Practical experience suggests that this is a pipe dream. It takes years for new Primary Trends to establish themselves.
From a technical perspective, the reason they “might” rise into new high territory is if the markets are anticipating inflation.
But “the markets” are not all anticipating inflation. Arguably, the gold price is the ultimate barometer of what the market thinks about inflation.
The chart below is one which I published on my website (www.beyondneanderthal.com ) in July 2008:
(Chart source: Stockcharts.com)
In July 2008, this chart was forecasting a price destination of $1403 an ounce – a level which has now been reached.
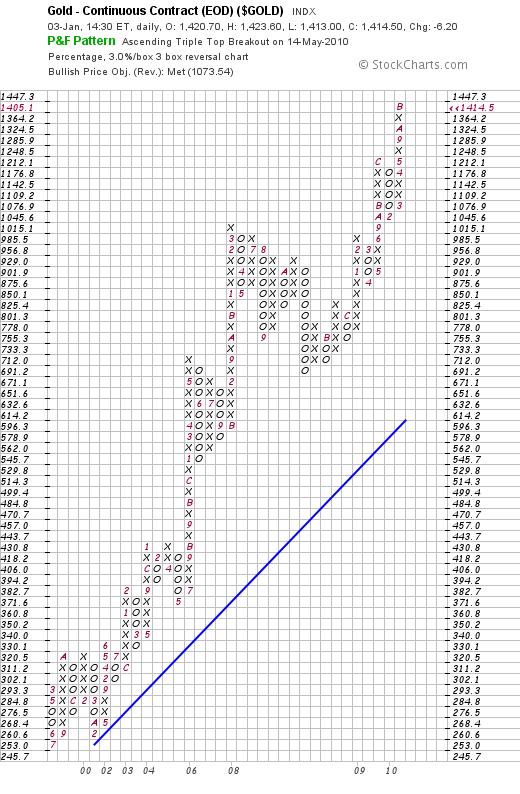
The chart below is of the same Point & Figure Chart view of the Gold Price as at today:
It is showing a “high pole” which, if it reverses, can bring the price of gold all the way back to $1,073 – which is still above its long term rising trend line
Now have a look at the weekly gold price chart on a conventional bar chart: (Chart source: Stockcharts.com)
Note how the Relative Strength Index has been falling and note also how the MACD is now below the MA of the MACD itself (47.087 vs 48.708). This crossover represents a “sell” signal – that manifested today (January 4th 2011).
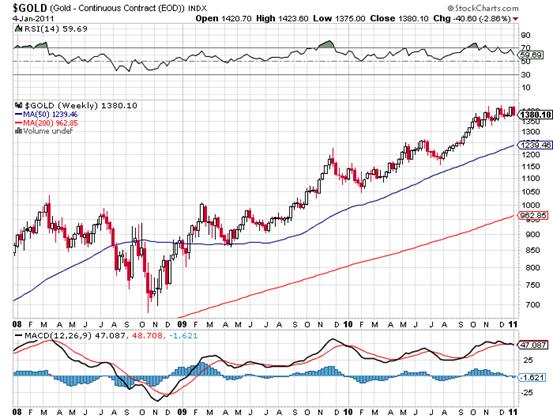
Let’s reflect on this sell signal for a moment. The commodity which is the bell-weather for inflation has given a technical sell signal on the weekly chart. i.e. The gold price is signalling that inflation is off the table for the moment.
But, against this background we now have the following:
- We have computer algorithms making buy/sell decisions without significant human involvement. Another good friend drew my attention to an article that was published in the New York Times on January 1st 2011, from which the following is a direct quote:
“In this high-tech stock market, Direct Edge and the other exchanges are sprinting for advantage. All the exchanges have pushed down their latencies — the fancy word for the less-than-a-blink-of-an-eye that it takes them to complete a trade. Almost each week, it seems, one exchange or another claims a new record: Nasdaq, for example, says its time for an average order “round trip” is 98 microseconds — a mind-numbing speed equal to 98 millionths of a second.”
- We also have the largest open interest position in commodities futures in history.
- We also have the USA approaching its legal public debt limit in an environment where the Republicans are saying that it’s time to balance the budget.
Interim Conclusion
Frankly, I would not be surprised to witness the emergence of that train smash that I have been worrying about. If the REE’s have been rising in price because of computer driven trading then they could fall for the same reason – and just as fast as they have been rising. If it were not for the low dividend yields I might be taking a different view. But the historically low dividend yields are an unarguable fact.
Finally, we should look at the dividend yields in context of the ten year US Government Bond yield chart below
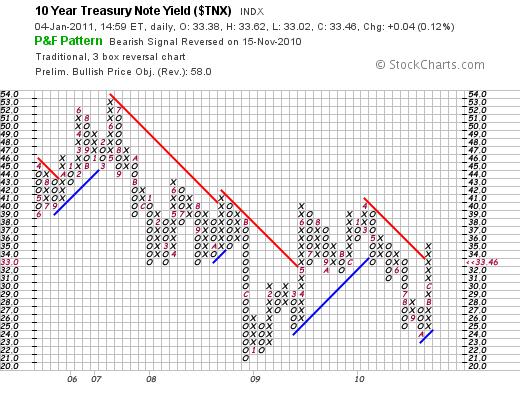
Note how it recently gave a “buy” signal and that the Point & Figure chart destination is a yield of 5.8% against its current yield of 3.346%
The “fact” is that the Point & Figure Chart of the ten year yield is now in a bull trend (see rising blue line)
The fact is that a bull trend in the ten year bond yield is both inconsistent and incompatible with a bear trend in dividend yields.
Something has to give. One way or another, dividend yields will be rising from this point forward. Again, we need to reflect on this. Even if share prices rise, dividends will have to rise faster in order for dividend yields to rise.
As a reasonable person, what do you the reader believe are the associated probabilities of an upward explosion in dividend payments?
Overall conclusion
Given both the overvalued and overbought levels of stock prices; and given the fact that the Republicans have taken a stance that they wish to balance the US budget against a background of US Public Debt reaching for its maximum legal level (which will undoubtedly be raised); and given the fact that the US Treasury Bond yields are in a bull trend, the US stock markets have almost certainly seen their peaks for the current rally which began in 2009. Whether the markets crash from here or whether they churn sideways for between 10-15 years, will be a function of what the US Government does.
Author Comment
Given the fact that the author hereof is not even in the same league as Professor Niall Ferguson, it might sound odd that I am prepared to stick my neck out to challenge one of his views. But challenge it I must because I think he is making a serious error of judgement when he argues that the Chinese economy will not be as badly affected as the rest of the world’s economies in the coming era of deflation.
My view flows from my own conviction that “energy” is what drives any economy; and from the fact that China has overcommitted in recent years to (rushed headlong into) legacy energy technologies. Alert readers will recall that at the beginning of this article I pointed out that energy was not even a subject that appears to be on the good professor’s radar screen as an economic driver. China’s environment is becoming extremely polluted in context of an absence of any “new paradigm” energy technology base that has sufficient gravitas to drive the Chinese economy in the foreseeable future. (10 - 15 years). The reader should bear with me here. There are other dots to connect.
If my understanding is correct, the primary reasons that the Chinese economy has been able to grow at a compound rate of 10% p.a. over a decade or more are:
- It built a manufacturing infrastructure (using foreign capital) that was geared to satisfy US (and other export market) consumer demands
- When the Global Financial Crisis hit, China was able to dodge the bullet for three reasons:
- The Central Chinese Government stimulated the economy; thereby making credit more easily available to the Chinese consumer
- Real Estate prices were high – which allowed Chinese citizens to leverage off their real estate equity and to take advantage of the easier credit.
- Because Real Estate prices were high, the “wealth effect” had put Chinese consumers in a frame of mind where they were happy to borrow and spend.
- The Real Estate “boom” in China was artificially created and is currently a bubble waiting to burst.
In short, my understanding of the ultimate cause of the Chinese Real Estate Bubble was that the local authorities – who have to be self funding and who do not charge property taxes – drove up real estate prices as principals. They borrowed money in their own right in order to develop the real estate market for their own accounts – which they sold off the plans to investors.
In an environment of deflation, the Chinese property balloon seems very likely to deflate along with everything else. If/when this happens, Chinese citizens’ purchases of Chinese manufacturer output will contract sharply.
Yes, China has large foreign exchange reserves – 22% of which are denominated in US dollars according to Professor Ferguson. But here’s a question he did not address either: “What proportion of its foreign exchange reserves is denominated in other fiat currencies, the value of which is dependent on the health of the US economy?”
The bottom line, in my view, is that the Chinese economy is not nearly as robust as Professor Ferguson argues – and that is the primary reason that the Shanghai Index is very likely going to break down.
So how are we going to claw our way out of this morass?
By Brian Bloom
Once in a while a book comes along that ‘nails’ the issues of our times. Brian Bloom has demonstrated an uncanny ability to predict world events, sometimes even before they are on the media radar. First he predicted the world financial crisis and its timing, then the increasing controversies regarding the causes of climate change. Next will be a dawning understanding that humanity must embrace radically new thought paradigms with regard to energy, or face extinction.
Via the medium of its lighthearted and entertaining storyline, Beyond Neanderthal highlights the common links between Christianity, Judaism, Islam, Hinduism and Taoism and draws attention to an alternative energy source known to the Ancients. How was this common knowledge lost? Have ego and testosterone befuddled our thought processes? The Muslim population is now approaching 1.6 billion across the planet. The clash of civilizations between Judeo-Christians and Muslims is heightening. Is there a peaceful way to diffuse this situation or will ego and testosterone get in the way of that too? Beyond Neanderthal makes the case for a possible way forward on both the energy and the clash of civilizations fronts.
Copies of Beyond Neanderthal may be ordered via www.beyondneanderthal.com or from Amazon
Copyright © 2010 Brian Bloom - All Rights Reserved
Disclaimer: The above is a matter of opinion provided for general information purposes only and is not intended as investment advice. Information and analysis above are derived from sources and utilising methods believed to be reliable, but we cannot accept responsibility for any losses you may incur as a result of this analysis. Individuals should consult with their personal financial advisors.
Brian Bloom Archive |
© 2005-2022 http://www.MarketOracle.co.uk - The Market Oracle is a FREE Daily Financial Markets Analysis & Forecasting online publication.