


It's Tough Being Bearish on Stocks
Stock-Markets / Stock Markets 2010 Dec 19, 2010 - 12:40 PM GMTBy: Guy_Lerner

 It is tough to be bearish for the following reasons: 1) the overwhelming consensus opinion of investors, bloggers, and newsletter writers is bullish now and into 2011; 2) the perception amongst investors is that the Federal Reserve has back stopped the market; 3) there is a persistence to the tape as it marches higher on both good and bad news; and 4) it is the holiday season where thinly traded markets can be easily manipulated higher. Yes, it is tough being bearish when everyone and everything you read is bullish, and the equity market can only go one way -- up. Yet, here I write that I am bearish. Why?
First, let me explain what I mean by bearish. This should NOT be a bull market top leading to a bear market. Bear markets come about when "buying the dip" fails. In other words, this overbought, over bullish market should correct providing a better risk adjusted buying opportunity in the future. Failure of a bounce to materialize at that point is a harbinger of a bear market. So bearish means that I expect to see a correction leading to a better risk adjusted buying opportunity, and this buying opportunity usually coincides with investors turning too bearish (i.e., bull signal).
So is this the market environment where I want to make that big bullish bet? From where I stand, the answer is no. The reward to risk is highly skewed in my opinion to the risk side of the equation, and this isn't because of sentiment alone. The market may go higher, and if it does, so be it. I will participate if the reward to risk profile, as I have defined these metrics, improves. Trading and investing is about managing risks. If you don't want to assume that responsibility of managing risks, then you should be a buy and hold kind of investor.
Lastly, let me clarify my time frame, and this should help clarify the analysis. The average time between a bear signal and the next buy signal is approximately 80 trading days. The next bull phase, when it comes, should last about 100 trading days. So my analysis is not suitable for the day trader looking to get the next 2% move. I would think what I am talking about here is for the trader who is intermediate term in nature and who tries to position themselves for major swings in the market. There will be a lot of ups and downs between now and the next quality buy signal.
The "Dumb Money" indicator (see figure 1) looks for extremes in the data from 4 different groups of investors who historically have been wrong on the market: 1) Investors Intelligence; 2) Market Vane; 3) American Association of Individual Investors; and 4) the put call ratio. The "Dumb Money" indicator has turned more bullish to an extreme degree, and this is a bearish signal.
Figure 1. "Dumb Money"/ weekly
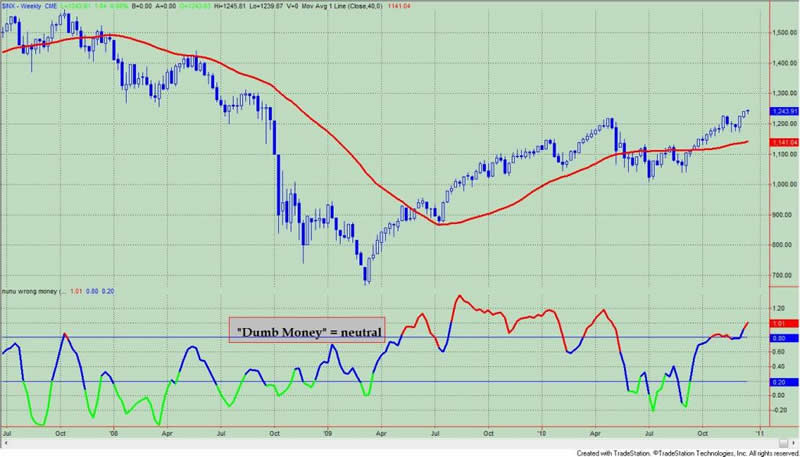
Figure 2 is a weekly chart of the SP500 with the InsiderScore "entire market” value in the lower panel. From the InsiderScore weekly report: "Insiders continued to sell at an aggressive clip last week and once again it was the Energy, Healthcare and Consumer Discretionary sectors setting the pace. These three sectors were the laggards when market-wide selling spiked to multi-year high levels in early November and their recent contributions have pushed many of our top-line sentiment metrics back towards those record levels."
Figure 2. InsiderScore "Entire Market" Value/ weekly
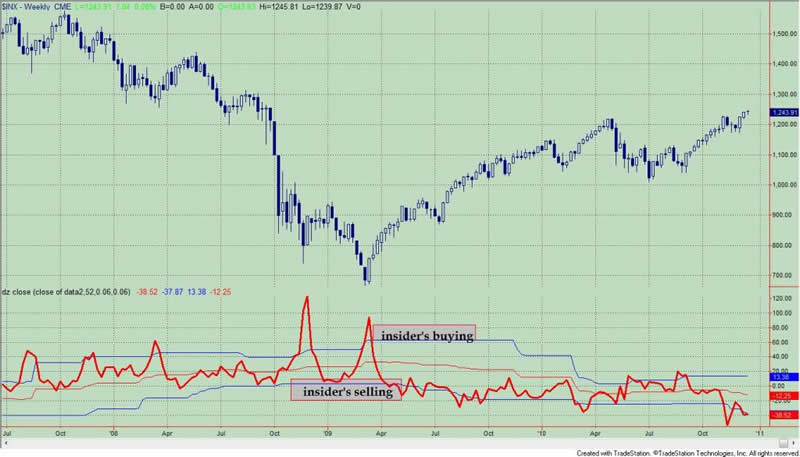
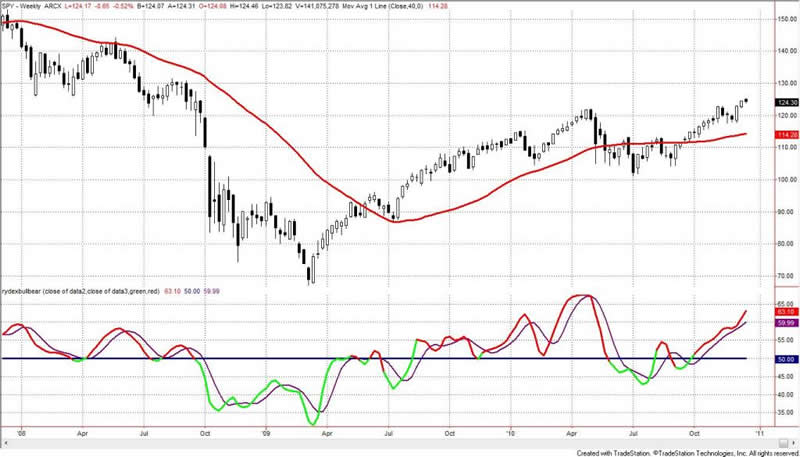
Figure 3 is a weekly chart of the SP500. The indicator in the lower panel measures all the assets in the Rydex bullish oriented equity funds divided by the sum of assets in the bullish oriented equity funds plus the assets in the bearish oriented equity funds. When the indicator is green, the value is low and there is fear in the market; this is where market bottoms are forged. When the indicator is red, there is complacency in the market. There are too many bulls and this is when market advances stall.
Currently, the value of the indicator is 63.10%. Values less than 50% are associated with market bottoms. Values greater than 58% are associated with market tops.
Figure 3. Rydex Total Bull v. Total Bear/ weekly
To subscribe to Premium Content click here: Subscribe
By Guy Lerner
http://thetechnicaltakedotcom.blogspot.com/
Guy M. Lerner, MD is the founder of ARL Advisers, LLC and managing partner of ARL Investment Partners, L.P. Dr. Lerner utilizes a research driven approach to determine those factors which lead to sustainable moves in the markets. He has developed many proprietary tools and trading models in his quest to outperform. Over the past four years, Lerner has shared his innovative approach with the readers of RealMoney.com and TheStreet.com as a featured columnist. He has been a regular guest on the Money Man Radio Show, DEX-TV, routinely published in the some of the most widely-read financial publications and has been a marquee speaker at financial seminars around the world.
© 2010 Copyright Guy Lerner - All Rights Reserved
Disclaimer: The above is a matter of opinion provided for general information purposes only and is not intended as investment advice. Information and analysis above are derived from sources and utilising methods believed to be reliable, but we cannot accept responsibility for any losses you may incur as a result of this analysis. Individuals should consult with their personal financial advisors.
Guy Lerner Archive |
© 2005-2022 http://www.MarketOracle.co.uk - The Market Oracle is a FREE Daily Financial Markets Analysis & Forecasting online publication.