


Gold Still a Potential Head and Shoulders Pattern Top?
Commodities / Gold and Silver 2010 Dec 12, 2010 - 12:52 PM GMTBy: Merv_Burak

 Still a potential head and shoulder pattern or not? See the short term analysis below. With all that’s happening in the world one would expect gold to go through the roof. It may still do so, in fact I believe it will, but the question is will it do so NOW or sometime in the future?
GOLD : LONG TERM
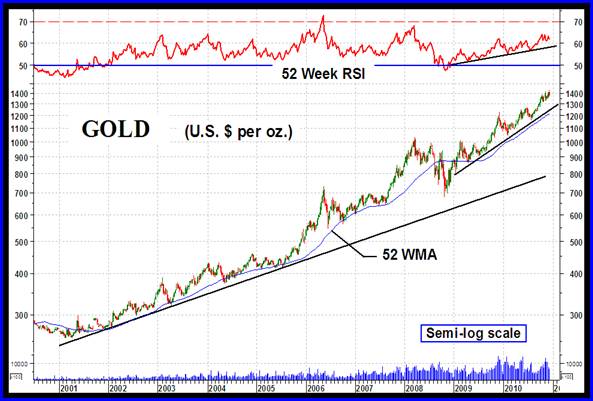
Every so often I like to look at the very long term chart and see where we are with the gold trend. When making long term “investment” decisions one should be on the right side of the very long term trend otherwise such “investment” decisions carry extra risk. Of course when making trading decisions the long and very long term trend is not that important, but the intermediate and short term are. I’m a simple technician so my look at the charts are from a simple perspective. Price trend and strength of trend are the guiding principles. One can get all caught up with sophisticated techniques but I have yet to come across a sophisticated technique that was that much better than the simple, and it usually requires a great deal more work for the extra minimal results. As long as one understands that the simple might come with errors but those errors should get straightened out rather quickly and one accepts this then the simple is for you. Nothing is perfect, the simple or the sophisticated.
For trend it only takes a couple of seconds to view the moving average and any trend line that can be simply drawn. As far as the present is concerned, we have both and both are still quite positive. As for the strength of the trend I use a long term version of the Relative Strength Index (RSI). Shown is the one year RSI (52 Week RSI). It is still in positive territory and above a two year up trend line so no problem here. As long as the price of gold stays above its trend line AND the momentum indicator stays above that up trend line then we can assume we are in good shape from the very long term perspective. Should either of these be broken, then we need to do a somewhat more extensive review.
From a very long term perspective I have noted in the past the weakening in the long term strength of the gold price trend. Since reaching an overbought peak in strength in mid-2006 that strength has peaked at lower levels during the early 2008 price peak and now, as the price moves slowly into higher levels (it might be peaking again) the strength in the price trend is at still lower levels. This is a very long term warning of continuing trend weakness that could result in a major reversal of trend, BUT it is only a warning and not a prediction. One would keep the warning in mind when making investment decisions but would not necessarily keep from long term investing.
As a technician with sometimes too much time on my hands I like to fiddle around with the charts, drawing all sorts of trend lines and stuff. Let’s draw a line from the 2001 top through the top in 2006. This line continues on through the top in 2008. Extending this trend line we get an upper resistance level for future price action somewhere into the $2000 level. This trend line, along with the lower trend line, makes up an expanding megaphone pattern. That pattern suggests an eventual plunge in prices. Expanding upward sloping megaphones suggest an eventual break to the down side. Boy, how quickly we have gone from above the $2000 level to below the $800 level. On the other hand should we draw a support up trend line through the 2006 and 2007 lows with a resistance parallel line through the 2006 high we get an up trending channel that captures the market action for the past 5 years with one short false break in late 2008. This channel would suggest we are at the upper resistance area and the most likely direction of longer term action is either to a sideways trend to lower levels. I guess we can flip a coin and go with that but play time is over, let’s get back to the serious “what’s happening now” business.
The long term point and figure chart is still comfortably in positive territory. It would take a move to the $1320 level to break below two previous lows but even lower to break below the latest up trend line so nothing yet to worry about here.
As for my normal indicators, the price remains above its positive moving average line. On a daily chart my normal long term momentum indicator is the 150 day RSI. It is still comfortably in its positive zone but has been making lower lows and lower highs since reaching its recent peak in mid-Oct. The price, on the other hand, has been showing higher lows and higher highs. If the price was moving sideways or lower one can expect this momentum activity but with the price moving ever higher this negative divergence action of the momentum indicator is a serious warning of loss of strength in the price move. The volume indicator is still showing strength and remains well above its positive sloping trigger line. All in all the long term rating remains BULLISH.
INTERMEDIATE TERM
The intermediate term indicators are giving the same message as the long term ones. The price is above a positive sloping moving average line but here the moving average is much closer to the price and in more danger of being crossed by the price action should we get a few more days of negative activities. The momentum indicator (shown in the short term chart) remains in its positive zone but as with the long term indicator is giving us a negative divergence versus the price action. It is also below its negative sloping trigger line. The volume indicator is still quite solidly in a positive mode above its positive trigger line. On the intermediate term the rating still remains BULLISH although the warnings are coming in. The short term moving average line remains above the intermediate term line for a continuing confirmation of this bull.
SHORT TERM
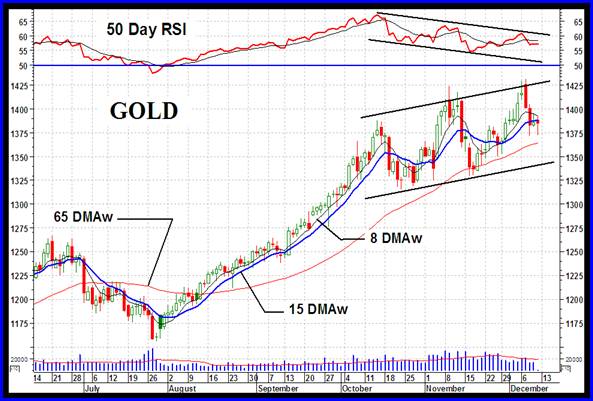
Shown on the chart one can clearly see the negative divergence action of the momentum indicator versus the price action. Shown is my intermediate term momentum indicator. The short term indicator shows the same divergence action (as does the long term momentum) but the action is more volatile. This intermediate term momentum gives a very clear picture.
Now, as for that potential head and shoulder pattern. At the potential right shoulder we now have the price action closing above the highest close at the head and also the intra-day high moving above the highest intra-day high of the head. So, one can say that the potential head and shoulder has been nullified and is no more. However, we do have another pattern just as powerful. We have an upward sloping channel in the price activity and a downward sloping action in the momentum activity. Should the price now move towards the lower support line (former H&S neckline) and break below it that would be just as significant a move as if we still had a H&S pattern break. BUT will the price move to the lower support and break below? That is the question. The price and momentum action could remain in their respective channels for some time, however, they will break out at some point. I expect that break to be to the down side but would not place any money on it at this time, it could go either way. A break to the up side, however, would most likely indicate an explosive move in progress. What would set that off? Who knows?
Getting back to the real world the short term indicators are mixed. The price closed below its short term moving average line and the line slope, although turning towards the down side, is still very, very slightly positive. The short term momentum indicator is toying with the negative zone but remains slightly in the positive. It is, however, below its negative sloping trigger line. As for the daily volume action, that suggests weakness as the daily volume has consistently been below a 15 day average volume throughout most of the recent advance. The short term rating is weakening but has not gone to a full bear. The rating on Friday close is at a – NEUTRAL level. The very short term moving average line is closing in on the short term line but is still slightly above the short term average. This confirms that the rating has not yet gone full bear but is in the process.
As for the immediate direction of least resistance, I’ll go with the down side. The very short term moving average line is sloping lower and the Stochastic Oscillator (SO) (not shown this week) is still in a downward phase. The SO may be in a very early phase of turning back to the up side so maybe the downside will be short lived.
SILVER
I guess I have blabbered on too long and time is running short once more. I’ll leave silver commentary for another day only to say here that although silver had a worse week than gold it is still the better performer for all three time periods (see the Table for information). The Spec-Silver Index is where the action remains and where the best performers remain.
PRECIOUS METAL STOCKS
The major North American Gold Indices were all lower this past week while the Merv’s Indices were mixed with 4 on the up side and 4 on the down side. The Spec-Silver Index was still the outstanding performer and this is where the action continues to take place.
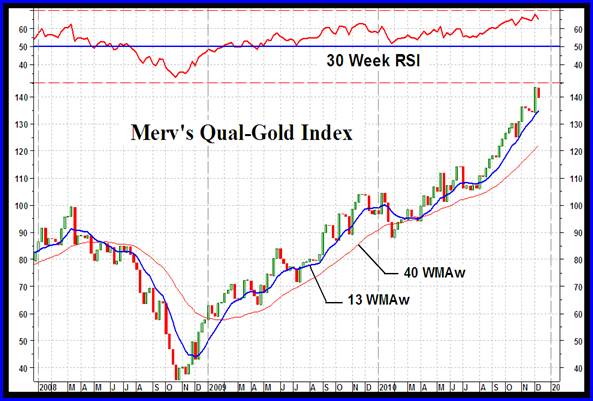
Shown this week is my Merv’s Qual-Gold Index of the top 30 gold and silver stocks (based upon market value) traded on the North American markets. If one wants to compare its performance versus the major Indices it would be the PHLX Gold/Silver Sector Index that would be the most direct comparison as the PHLX has the largest stocks included. The PHLX Index is barely above its previous 2008 high while the Qual-Gold Index is 40% above its 2008 high. Of course the more speculative Indices have a far greater performance.
As the chart shows the Index is above its positive sloping long term moving average line and the long term momentum indicator is still comfortably in its positive zone. As long as we continue with that scenario we are not in trouble from the long term perspective.
Merv’s Precious Metals Indices Table
Well, that’s it for this week. Comments are always welcome and should be addressed to mervburak@gmail.com.
By Merv Burak, CMT
Hudson Aero/Systems Inc.
Technical Information Group
for Merv's Precious Metals Central
For DAILY Uranium stock commentary and WEEKLY Uranium market update check out my new Technically Uranium with Merv blog at http://techuranium.blogspot.com .
During the day Merv practices his engineering profession as a Consulting Aerospace Engineer. Once the sun goes down and night descends upon the earth Merv dons his other hat as a Chartered Market Technician ( CMT ) and tries to decipher what's going on in the securities markets. As an underground surveyor in the gold mines of Canada 's Northwest Territories in his youth, Merv has a soft spot for the gold industry and has developed several Gold Indices reflecting different aspects of the industry. As a basically lazy individual Merv's driving focus is to KEEP IT SIMPLE .
To find out more about Merv's various Gold Indices and component stocks, please visit http://preciousmetalscentral.com . There you will find samples of the Indices and their component stocks plus other publications of interest to gold investors.
Before you invest, Always check your market timing with a Qualified Professional Market Technician
Merv Burak Archive |
© 2005-2022 http://www.MarketOracle.co.uk - The Market Oracle is a FREE Daily Financial Markets Analysis & Forecasting online publication.