


Is The Herd Trading Gold and SP500?
Stock-Markets / Financial Markets 2010 Dec 09, 2010 - 10:06 AM GMTBy: Chris_Vermeulen

 Over the past 2 weeks we have seen the market sentiment change three times from extreme bullish to bearish and back to bullish as of today. Normally we don’t see the herd (average Joe) switch trading directions this quickly. Over the past 10 years I found that the average time for the herd to reach an extreme bullish or bearish bias takes between 4-6 weeks in length. It is this herd mentality which makes for some excellent trend trading opportunities. But with the quantitative easing, thinner traded market, and lack of trading participants (smaller herd) I find everyone is ready to change directions at the drop of a hat.
The old school traders/investors who don’t use real-time data or charts, and who dabbled in stock picks here and there have mostly exited the trading arena from frustration or losing to much money. This group accounted for a decent chuck of liquidity in the market and was also the slowest of the herd to change directions.
The new school, today’s smaller herd is much more aggressive and quicker to act on market gyrations. I think this is because the only people left in the market are those who make a living pulling money from the market and those who feel they are really close to mastering the stock market. It is these individuals who are using trading platforms with real-time data, charts and scanners to help get a pulse on the market so they can change directions when the big boys do. I feel this is the reason why the market is able to turn on a dime one week to another over the past 8 months… The easy prey (novice and delayed data traders) are few and far between and the fight to take money for other educated traders seems to be getting a little more interesting to say the least.
Anyways, enough about the herd already…
It’s been an interesting week thus far with stocks and commodities. The week started with a large gap up only for strong selling volume to step in and reverse direction the following day. It is this negative price action that starts to put fear into the market triggering a downward thrust in the market. During an up trend which we are in now, I look for these bearish chart patterns to form as they tend to trigger more selling the following days which cleanses the market of weak positions. Once a certain level of traders have been shaken out of their positions and are entering positions in order to take advantage of a falling market, that’s when we get the next rally, catching the majority of traders off guard as they panic to buy back their short positions. It’s this short covering which sparks a strong multi day rally and kicks off the new leg up in the market.
Currently we getting some mixed signals. The market sentiment is the most bullish it has been since 2007, just a little higher than the Jan & March highs this year. This makes me step back and think twice about taking any sizable long positions. Any day now the market could roll over. Another bearish signal is the fact that we just had a very strong reversal day for stocks and metals to the down side. That typically leads to more selling.
But if we look at the positive side of things, the trend is still up, this is typically a strong time for stocks as we go into Christmas/Holiday season, also the market breadth is really strong with the number of stocks hitting new highs has really taking off.
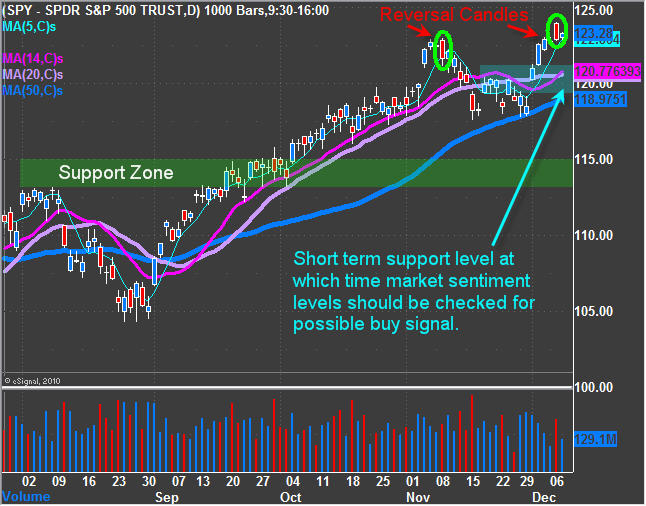
SP500 – Daily Chart
Below you can see the reversal candles along with short term and intermediate support levels. Although the market sentiment is screaming a correction is near, we must realize that sentiment can remain at this level for an extended period of time while the market continues to trend. This is one of the reasons why we say “The Trend Is Our Friend”.
I am hoping for a pullback and would like to see market sentiment shift enough on an intraday basis to give us a low risk entry point.
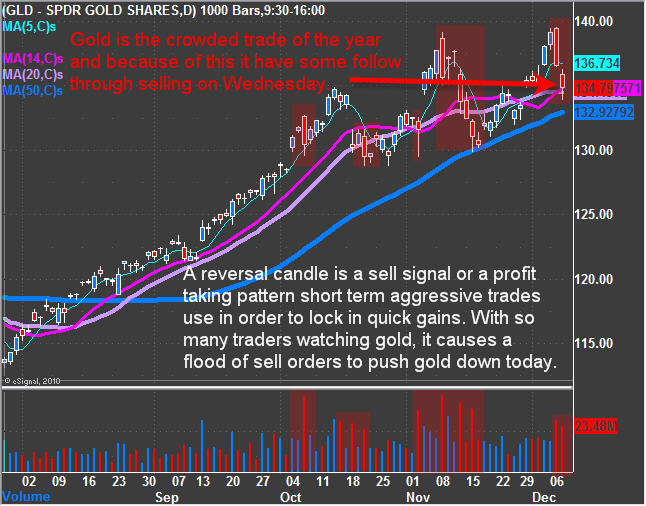
Gold – Daily Chart
A reversal candle is seen as a sell signal or a profit taking pattern. Short term aggressive trades use these to lock in quick price movements. With so many traders watching gold, it caused a flood of sell orders to push gold down today.
Mid-Week Conclusion:
In short, each time we see some decent selling in the market its get bought back up. Today was another perfect example as we had an early morning sell off, then a light volume rally for the second half of the session and a end of day short squeeze during the last 30 minutes. Gold has pulled back to the first short term support level. Because of the large following in gold I would like to see if there will be another day of follow through selling before possibly looking to take a trade.
I’d like you to have my ETF Trade Alerts for Low Risk Setups! Get them here: http://www.thegoldandoilguy.com/specialoffer/signup.html
Also Follow Me on Twitter in Real-Time: http://twitter.com/GoldAndOilGuy
By Chris Vermeulen
Chris@TheGoldAndOilGuy.com
Please visit my website for more information. http://www.TheGoldAndOilGuy.com
Chris Vermeulen is Founder of the popular trading site TheGoldAndOilGuy.com. There he shares his highly successful, low-risk trading method. For 6 years Chris has been a leader in teaching others to skillfully trade in gold, oil, and silver in both bull and bear markets. Subscribers to his service depend on Chris' uniquely consistent investment opportunities that carry exceptionally low risk and high return.
This article is intended solely for information purposes. The opinions are those of the author only. Please conduct further research and consult your financial advisor before making any investment/trading decision. No responsibility can be accepted for losses that may result as a consequence of trading on the basis of this analysis.
Chris Vermeulen Archive |
© 2005-2022 http://www.MarketOracle.co.uk - The Market Oracle is a FREE Daily Financial Markets Analysis & Forecasting online publication.