


Euro, USD, Gold and Stock Index Analysis
Stock-Markets / Financial Markets 2010 Dec 01, 2010 - 02:46 PM GMTBy: Bari_Baig

 The Good Days: From the get go, today seemed like a good day. A day, when most things fall in place almost perfectly and should I emphasis without much effort. Same could be said about the investment world. Regardless of the media’s hype about EU debt crisis or the Wiki Leaks which surely aren’t investment world’s secret “cables”, even the global markets are breathing a sigh of relief and optimism as even the BEARs amongst us know, a Bull market is just more fun!
Starting from Euro, which earlier today traded high 1.29s [1.297 precisely] has managed to push itself back over 1.31 and as we write a rumor came straight from a top of the tallest skyscraper of a possible U.S support to IMF for European Bailout. Well, we can’t vouch for the authenticity of this news nevertheless just as the rumor came, Euro was testing its neckline of the bottom that it had made in early Asian trading so on technical grounds the leg up was a mere continuation pattern so to speak. Euro had really become too oversold and even with this upward move to 1.315 not much has changed. That surely doesn’t mean that one should forget everything and jump off the proverbial cliff of optimism thinking they’d survive the jump, just because they have “optimism” on their side. We see Euro pushing on further with primary resistances starting from 1.3225 and therefore anything over low 1.32s should be capitalized by selling into Euros and not adding to Longs. The downward “Channel” which Euro is following has the upper side capped at 1.337 but to us this wave of optimism would start hitting the rocks much before that as Euro hits the “Major Resistance” region.
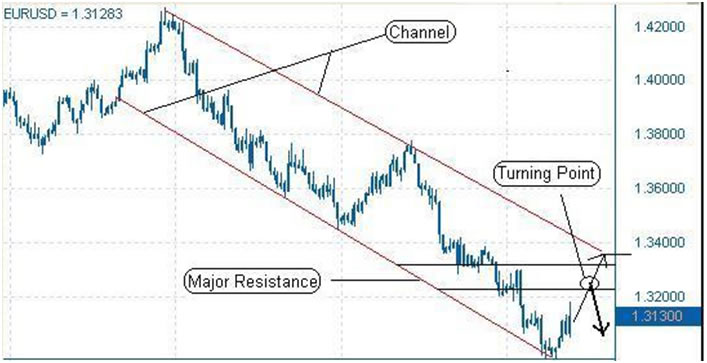
Euro may not start the downward leg immediately but the most likely scenario would be a sideways trend which may eventually coincide or just run short of the upper channel line. So, we say “Go Bulls” for 2 days at most and have those stops in place because when this “Giant” starts roaring it could shatter the ear drums as while being within the confines of this channel Euro could post a new low of just below 1.25s.
Now, moving on to gold which as we had stated yesterday in our article [Could Gold Replace Euro], finds itself at the very centre of the precious metal stage. Gold in Euro terms has smartly risen and is now making new highs, however, in terms of U.S Dollars it is still short by $35 per oz from hitting the record high it posted back in November 9th of $1,425 nonetheless, keeping in view how violent Gold’s move have been in past several weeks to imagine whether gold could take out the high tomorrow or day after isn’t difficult to comprehend.
Until yesterday techies “Technical follower” where very much of the view that Gold might have been tracing out a typical head and shoulder pattern, it was a false alarm! One which looked very convincing but it is now no more valid and hence we should move on. Gold is going to maintain its high bid status but at the same time it would run into turbulence as it approaches the record highs most likely beginning of coming week. In the next two sessions we see Gold trading $1,405 or at breach of $1,400 per oz at least maintaining it steadily for the coming week. Once the high is broken gold prices could quickly accelerate upwards to high $1,470s at which point Gold would start on a corrective phase. Gold has been discounting the inverse correlation with U.S Dollar lately nevertheless we find Green Back Index [DXY] which seems to have completed its leg up after the break of 79.6 to mid 81s to be in a sideways consolidative pattern which would further make things easier for Gold as it proceeds ahead.
In the Gold chart we can clearly see RSI inches away from breaking the downward trend on a daily chart and the H&S pattern being violated as well. The chart of U.S Dollar index shows clearly the second leg has been completed and before prices move upward to low 83s it should first consolidate.
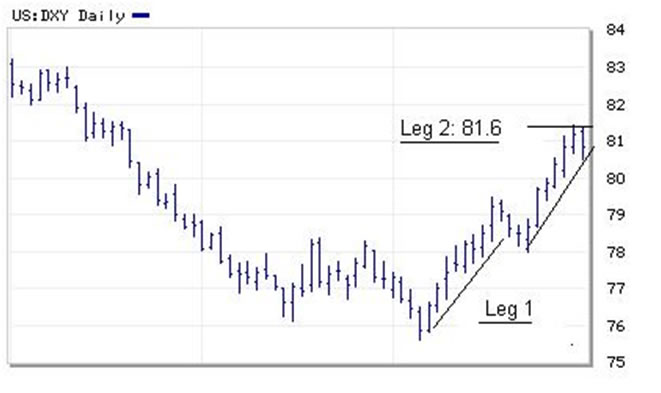
The economic data which came out of U.S was better than street’s guesstimates. The Chicago purchasing Manager’s report came at 62.5 up by 1.9 from last month. The Conference board’s consumer confidence index also rose by 3.9 to 54.1 beating the street’s expectation by 2.1 index points. As the data is out therefore we do not see any sudden upward move in the index and at best see consolidation as already stated above. Between high 79s and low 80s would be a good region to start buying into the Index.
Lastly, let’s have a look at U.S equities which much like other indexes around the world have had a bumpy ride since early last week. As we wrote in our article [The Commodities and Equities Circus] dated November 24th on www.marketprojection.net that “U.S equities to us seem to be moving like a rudderless ship which is being tossed about by the waves which in this case the ever changing news”. The circus of 1 day gain versus 1 day loss now seems to have ended, finally! It sure looks that way nevertheless we’d give it one more day before we can be sure as there’s no substitute of a test meaning the Dow could trade high 11,100 or more precisely a 11,186s. A pull back from thereon would further put strength into the trend. As Fed’s Beige book shows a brighter picture with improving conditions in manufacturing, hiring and retail spending, U.S equities might very strike gold as they head towards new highs.
The graph above shows RSI and the trend to be leaning towards the upside. Fingers crossed.
By Bari Baig
http://www.marketprojection.net
© 2010 Copyright Bari Baig - All Rights Reserved
Disclaimer: The above is a matter of opinion provided for general information purposes only and is not intended as investment advice. Information and analysis above are derived from sources and utilising methods believed to be reliable, but we cannot accept responsibility for any losses you may incur as a result of this analysis. Individuals should consult with their personal financial advisors.
© 2005-2022 http://www.MarketOracle.co.uk - The Market Oracle is a FREE Daily Financial Markets Analysis & Forecasting online publication.